
Every candlestick in a price chart captures a battle between buyers and sellers over a specific period. It reveals key clues about market momentum, sentiment shifts, and potential future moves. Candlestick charts are one of the most powerful ways traders visually read and interpret that story in real time. Beyond individual candles, professional traders also study candlestick patterns, which involve the combinations of one, two, or three candles.
By learning to recognise specific candlestick types and understanding the behaviour they represent, traders gain an edge and can read the market with greater speed, confidence, and accuracy. It doesn’t matter if you’re trading forex, stocks, cryptocurrencies, commodities, indices, or any other asset class. You’ll definitely see one of these candlestick types or patterns. In this article, we’ll explore 70+ candlestick types and patterns every trader should know, how to interpret them, and how to use them as powerful confluences in your price action strategy.
1. Bullish Engulfing
A Bullish Engulfing pattern is a two-candle reversal formation where a small bearish candle is completely “engulfed” by a larger bullish candle. It indicates strong buying pressure, showing that buyers have overcome previous selling, and often signals a potential price reversal to the upside after a downtrend. You’ll typically see this pattern at the bottom of a downtrend, in discount zones, or near key support levels.
The pattern consists of two candles: the first is a small bearish red candle, and the second is a large bullish green candle that completely covers the first one. The key rule for a Bullish Engulfing pattern is that the body of the bullish candle must fully cover the body of the bearish candle. While the size of the wicks is less important, the focus should be on the body dominance. The second candle shows a strong shift in momentum, where sellers initially pushed the price down but lost control, allowing buyers to take over with strong momentum. A Bullish Engulfing pattern is often seen as a signal for a potential trend reversal or a continuation of an uptrend, especially when it forms at a support level.

Bullish Engulfing Pattern: A powerful signal of buyer strength!
2. Hammer
A Hammer is a single bullish candlestick with a small body at the top and a long lower wick. It shows that while sellers initially pushed the price lower, buyers aggressively stepped in, driving the price back up and closing near the high. This suggests a potential trend reversal. Hammers typically form in discount zones. For a candlestick to be considered a true Hammer, the lower shadow (wick) must be at least twice the size of the body.
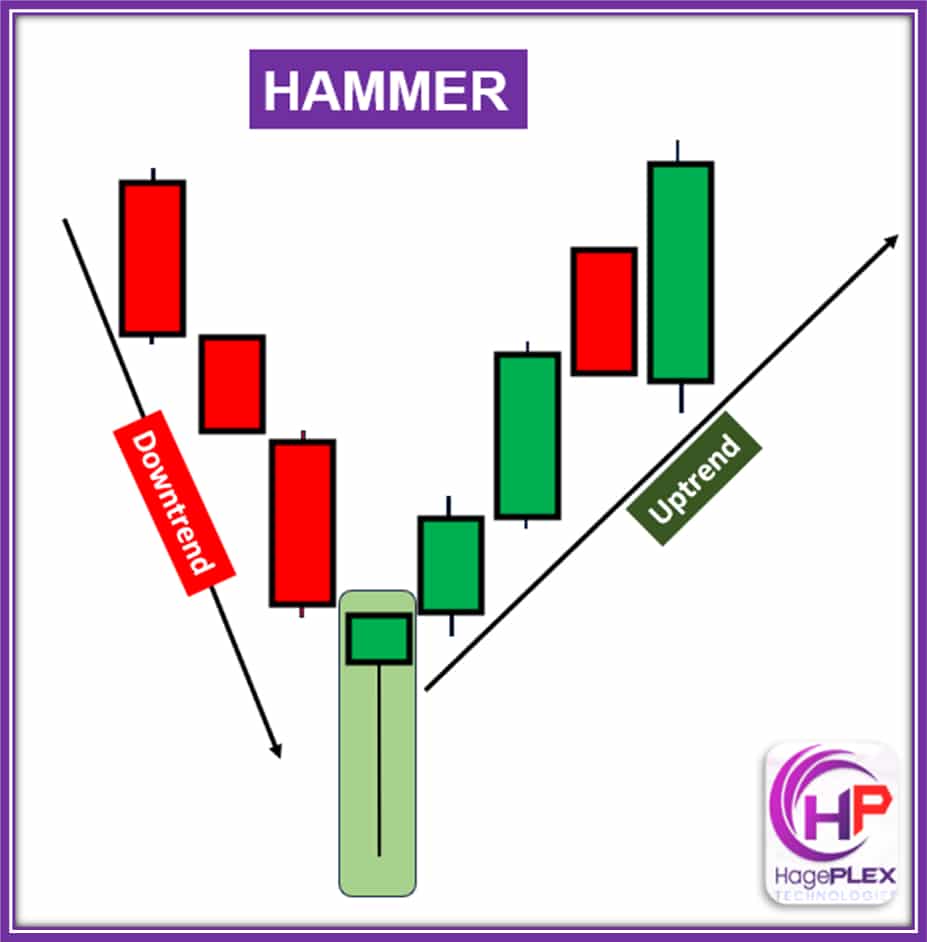
Hammer Candle: A strong rejection of lower prices! Buyers step in after heavy selling, signaling a potential bullish reversal
3. Inverted Hammer
The Inverted Hammer is a bullish reversal candlestick pattern that typically appears at the bottom of a downtrend. You’ll often see it near key support levels or in discount zones, especially after a stretch of strong bearish candles. It’s a single-candle formation with a small real body near the bottom of the candle’s range and a long upper wick, usually at least twice the size of the body, with little or no lower wick.
While the Inverted Hammer can be either green (bullish) or red (bearish), a green candle is generally seen as a stronger signal. What this candle tells us is that buyers tried to push the price higher during the session, even though the price eventually closed near where it opened. This shows early signs of bullish pressure starting to build after a decline.
A key thing to remember is the difference between an Inverted Hammer and a Shooting Star: they look similar, but the Inverted Hammer forms at the bottom of a downtrend, while the Shooting Star appears at the top of an uptrend. The Inverted Hammer suggests that sellers may be losing control and buyers could be stepping in—but it still needs confirmation, such as a strong bullish candle the next day or a breakout above the candle’s high.
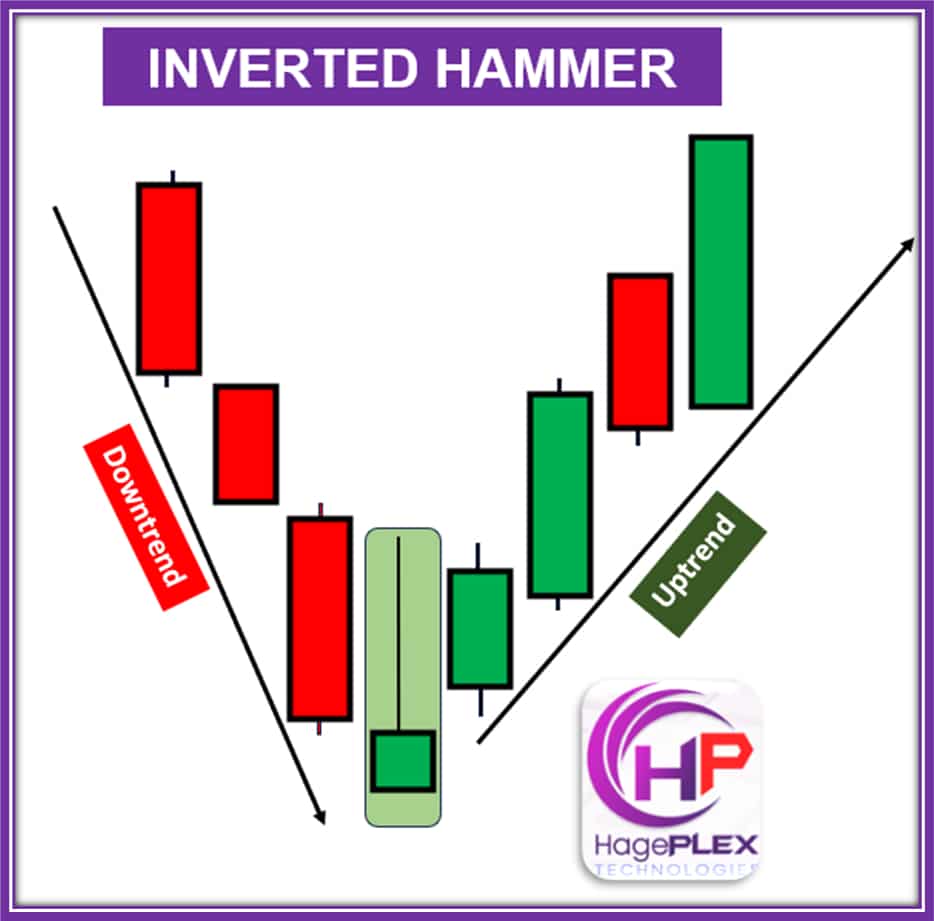
The Inverted Hammer shows buyers throwing their first punch after heavy selling, a bold sign that the bulls might be waking up.
4. Morning Star
The Morning Star is a bullish reversal candlestick pattern that typically forms at the bottom of a downtrend. It often appears in discount zones or areas of demand—places where the price is considered undervalued and likely to attract buying interest. This pattern signals a potential shift in momentum from bearish to bullish.
Structurally, the Morning Star consists of three candles. The first is a strong bearish (red) candle, which confirms the existing downtrend. The second is a small-bodied candle, often a doji or indecision candle, that opens with a gap down from the first. This candle reflects hesitation in the market and a possible rejection of further downward movement. The third is a strong bullish (green) candle that closes at least halfway into the body of the first candle, indicating that buyers are gaining control.
To understand the Morning Star more clearly, you should focus on reading what each candle represents. The first candle shows strong selling pressure, the second shows indecision, and the third confirms a reversal with bullish momentum. For added reliability, this pattern is best used alongside volume confirmation or other technical confluences, such as Fair Value Gaps, Order Blocks, or higher timeframe support levels.
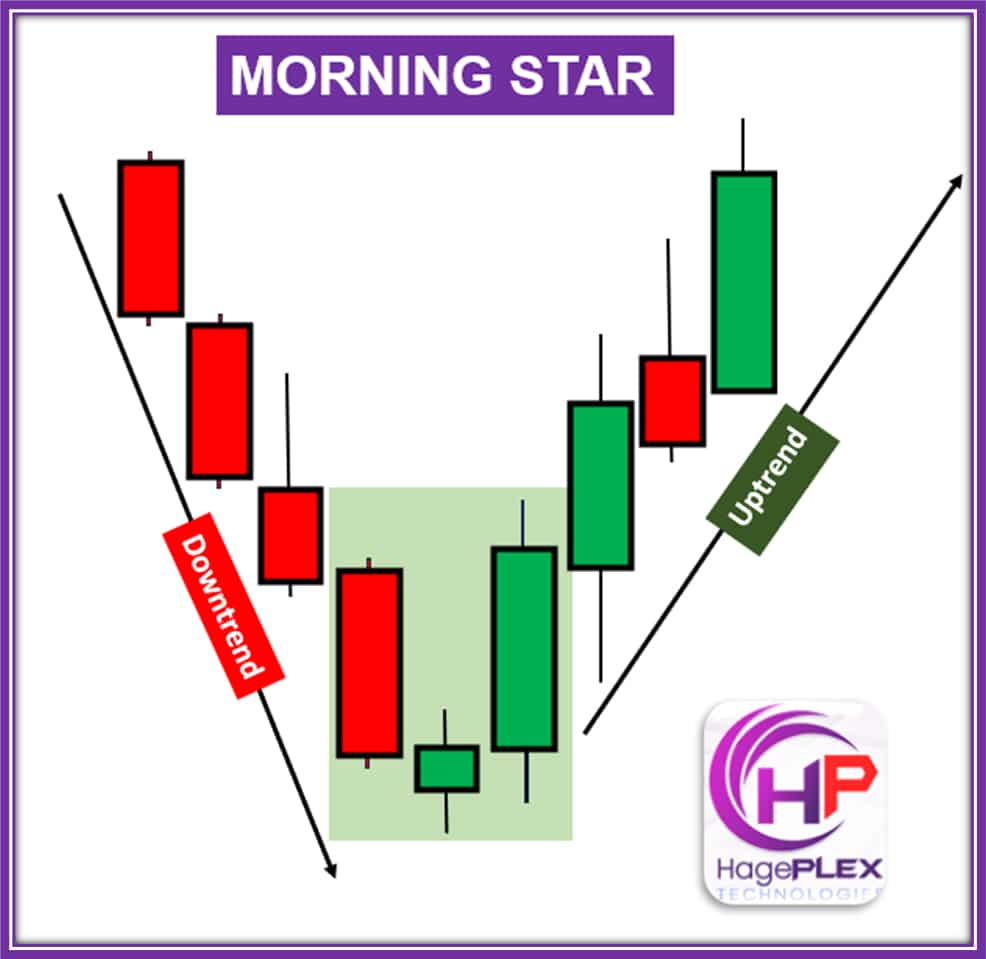
Morning Star: A new dawn for the bulls! After a tough battle with sellers, buyers rise with fresh strength, signaling the start of a potential upward move
5. Piercing
The Piercing Pattern is a bullish reversal candlestick pattern that consists of two candles. It typically appears after a downtrend and signals a potential shift in momentum from sellers to buyers.
The first candle in this pattern is a strong bearish (red) candle, which confirms the ongoing selling pressure. The second candle is a bullish (green) candle that opens below the low of the previous bearish candle. Importantly, this bullish candle must close at least 50% into the body of the first candle. The deeper this second candle pushes into the first candle’s body, the stronger the reversal signal becomes.
So, what does the Piercing Pattern tell us? It suggests that sellers initially tried to continue the downtrend, but buyers stepped in aggressively and regained control by pushing the price significantly higher. This change in momentum may indicate that the market is ready to move upward. The Piercing Pattern is especially meaningful when it forms after a prolonged downtrend or near a key support level, signaling a potential trend reversal or bullish bounce.
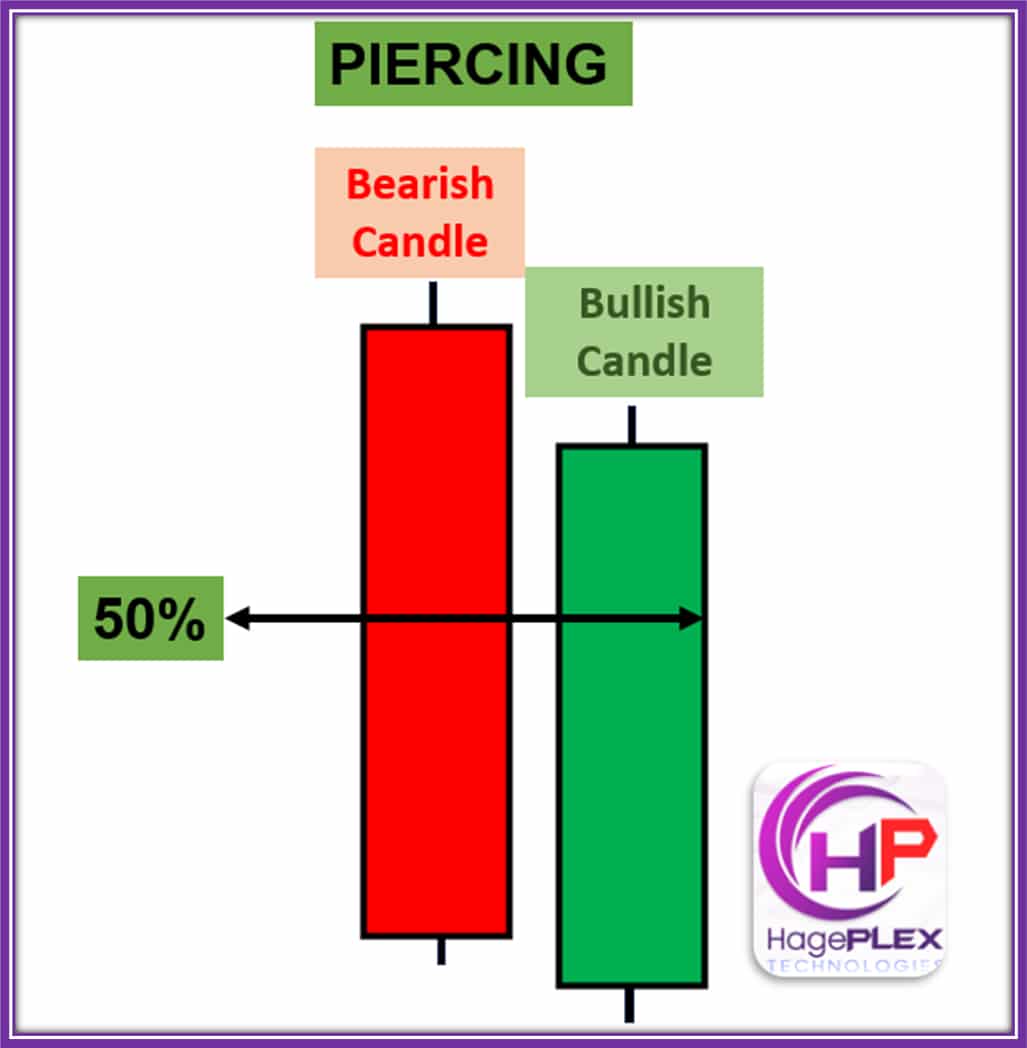
After heavy selling, buyers charge in with a powerful recovery — a key sign of a potential trend reversal.
6. Dragonfly Doji
The word “Doji” comes from Japanese, meaning “at the same time” or “simultaneous.” In trading, a Doji candlestick represents a moment of indecision between buyers and sellers, where the market opens and closes at nearly the same price.
The Dragonfly Doji is a specific type of Doji and is considered a bullish reversal pattern, though it requires confirmation. This pattern usually forms at the bottom of a downtrend and has a shape that closely resembles the letter “T.” It forms when the price drops significantly during a session, but buyers step in strongly and push the price back up to the opening level by the close. This movement signals a rejection of lower prices.
So, what does the Dragonfly Doji tell us? It shows that sellers were in control at first, but buyers regained strength by the end of the trading session. This change indicates a potential shift in market sentiment from bearish to bullish. However, it’s important to wait for confirmation—typically a strong bullish candle afterward—before making any trading decisions based on this pattern. With confirmation, the Dragonfly Doji becomes a high-probability signal for a bullish reversal.
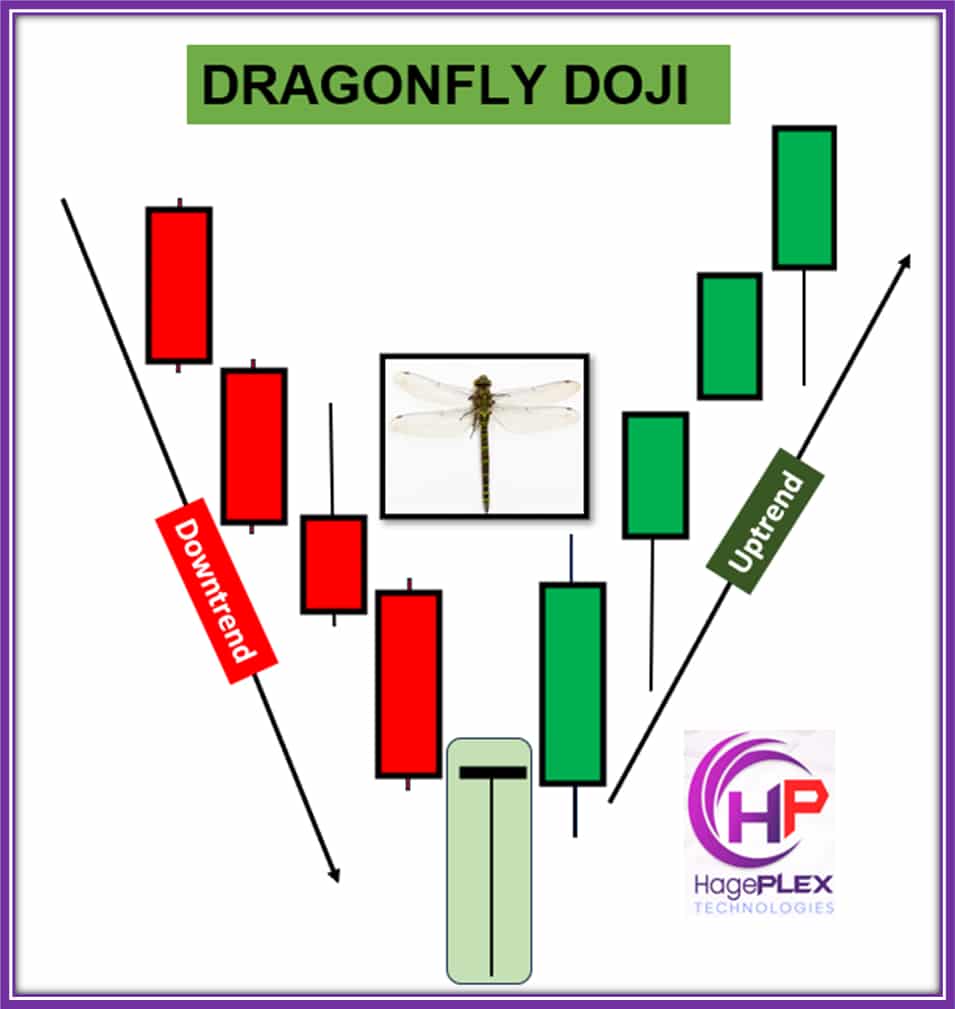
Dragonfly Doji: Silent but powerful! A strong rejection of lower prices — buyers step in quietly, hinting at a potential bullish reversal
7. Morning Star Doji
The Morning Star Doji is a bullish reversal candlestick pattern and a variation of the classic Morning Star. It typically forms at the bottom of a downtrend, especially in discount zones or demand areas, where price is considered undervalued and potential buying interest is strong.
This pattern consists of three candles. The first candle is a strong bearish (red) candle, showing strong selling pressure. The second candle—unlike the standard Morning Star—is a Doji, which means the market opened and closed at nearly the same price, forming a candle with a small or no body. This Doji usually gaps down from the first candle and represents indecision or a rejection of lower prices, suggesting that sellers may be losing control.
The third candle is a strong bullish (green) candle that closes at least halfway into the body of the first candle. This candle indicates that buyers are stepping in with momentum, shifting the sentiment from bearish to bullish.
It signals that selling pressure is weakening, buyers are regaining control, and a potential trend reversal to the upside is beginning to form.
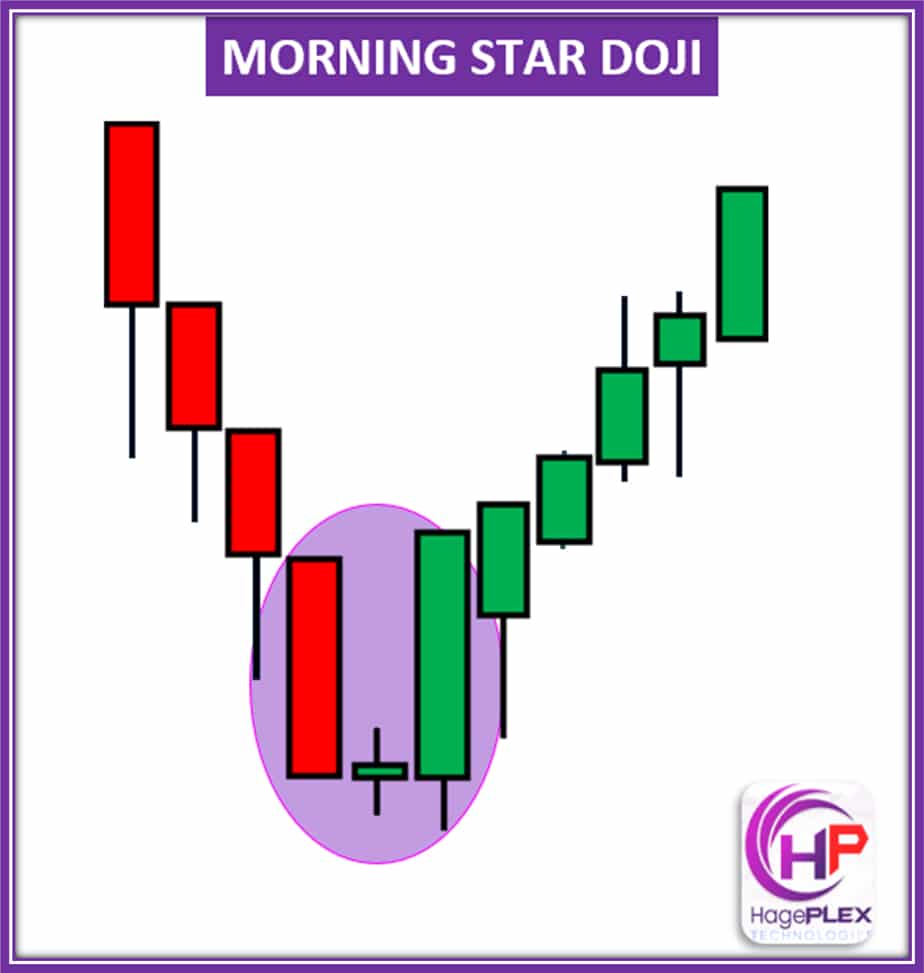
Morning Star Doji: A calm before the bullish storm. Indecision meets reversal as buyers reclaim control after seller exhaustion
8. Bullish Harami
The Bullish Harami is a two-candle reversal pattern that typically signals a potential shift from bearish to bullish momentum. It forms during a downtrend and is made up of two candles. The first candle is a strong bearish (red) candle, showing continued selling pressure. The second candle is a small bullish (green) candle that is completely contained within the body of the first candle.
This pattern is often described using a “mother and child” analogy, where the larger bearish candle represents the mother, and the smaller bullish candle is the child. This visual helps explain the idea that momentum is slowing down, as the market is no longer pushing to new lows.
What does the Bullish Harami tell us? It suggests that sellers are losing control, and buyers may be stepping in cautiously, showing early signs of reversal. The appearance of this pattern means bearish momentum is weakening, and although it’s not an aggressive bullish signal on its own, it often precedes a trend shift or a bullish bounce, especially when supported by other technical confluences or confirmation candles.
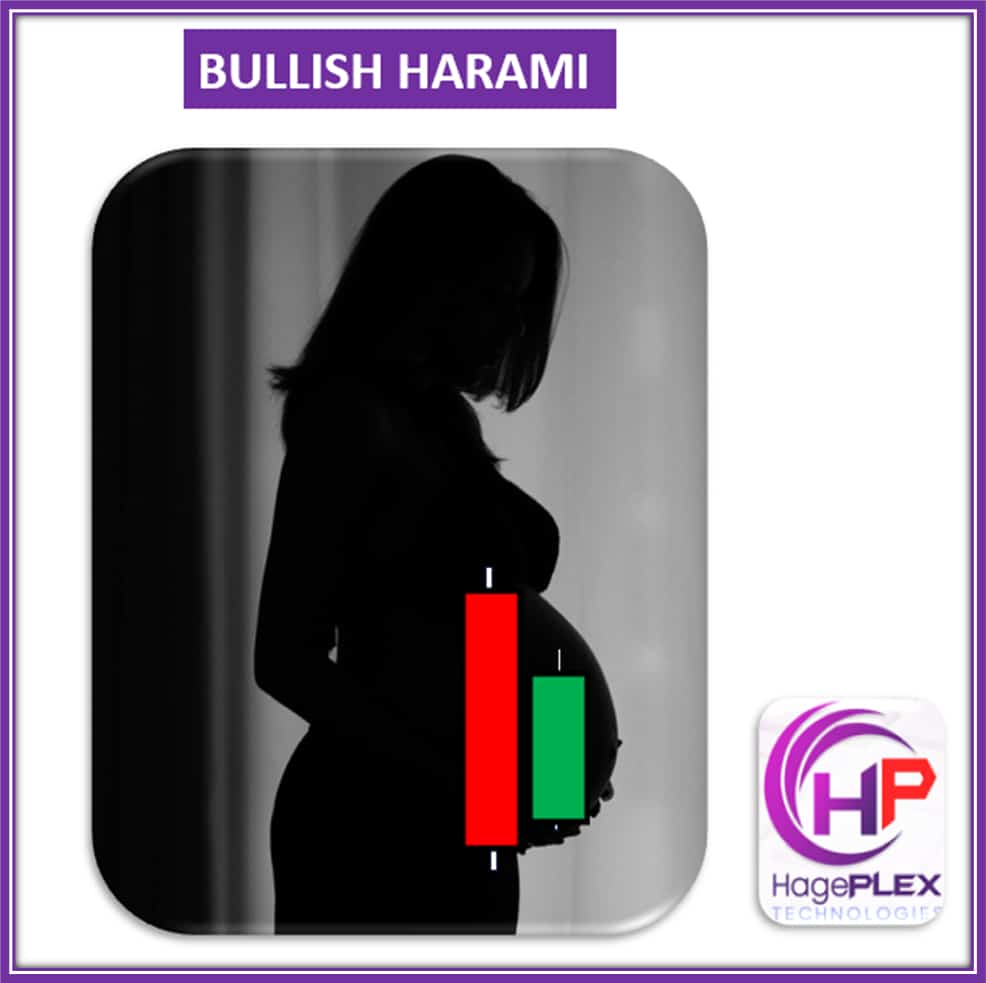
Bullish Harami: The child candle hides within the bearish mother — a quiet shift in power, hinting at a possible bullish reversal ahead.
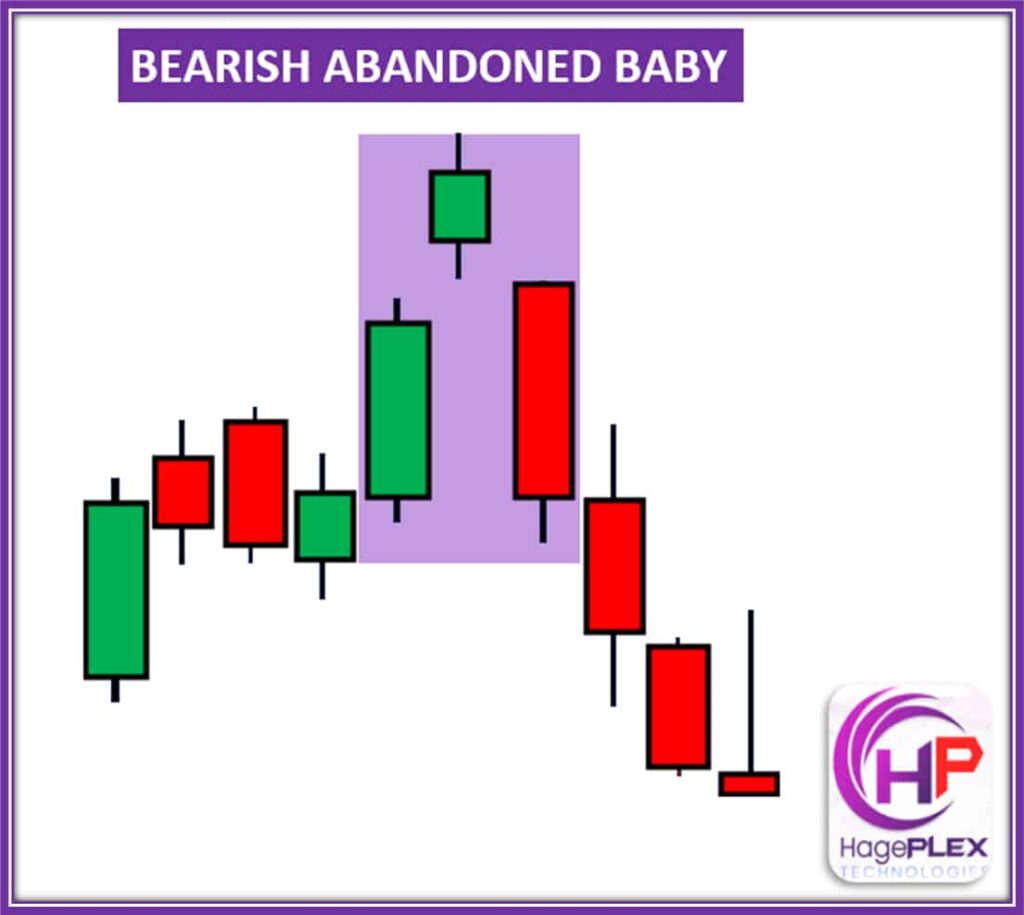
9. Bullish Abandoned Baby
The Bullish Abandoned Baby is a three-candle reversal pattern that typically appears at the end of a downtrend and signals a potential strong reversal to the upside. The first candle is a large bearish (red) candle that shows continued selling pressure. The second candle is a Doji or small-bodied candle that gaps down from the first. This gap, along with the indecisive nature of the Doji, suggests market hesitation and indecision among traders. Finally, the third candle is a strong bullish (green) candle that gaps up above the Doji and closes with solid momentum, confirming a reversal.
This pattern tells us that selling momentum has likely exhausted, and buyers have stepped in decisively. The gap between the first and second candle, and again between the second and third, makes this formation unique and powerful. It represents a complete rejection of lower prices and a clear shift from bearish to bullish sentiment.
Though rare, the Bullish Abandoned Baby is a highly reliable signal when it does appear, especially when confirmed by volume or support zones. It often marks the beginning of a new bullish phase in the market.
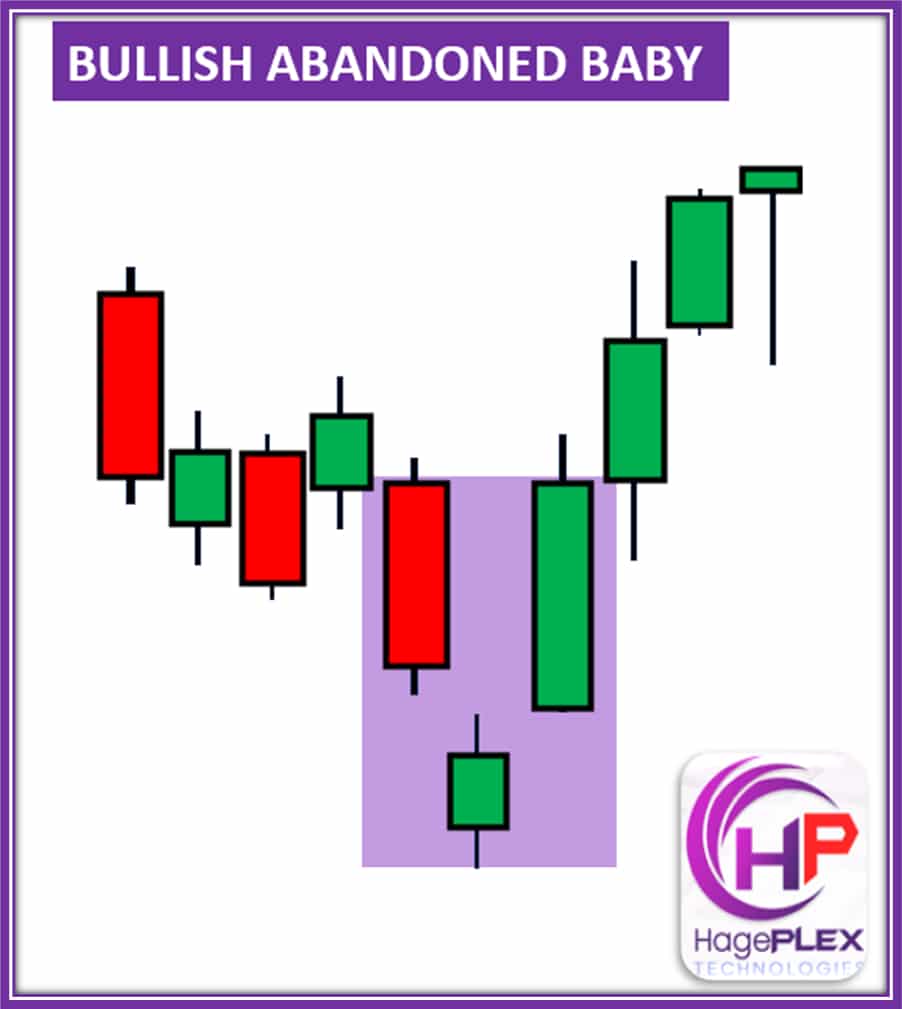
Bullish Abandoned Baby: Left behind but not forgotten! After a lonely Doji gap, buyers return with force, signaling a powerful bullish reversal.
10. Tweezer Bottom
The Tweezer Bottom is a bullish reversal candlestick pattern that consists of two candles with matching or nearly equal lows. The first candle is a bearish (red) candle, which shows that sellers were in control and pushed the price downward. The second candle is a bullish (green) candle that opens near the previous close and then moves upward, often closing higher. What stands out in this pattern is that both candles test and reject the same low price level, suggesting a strong support zone.
This formation tells us that bears tried to push the price lower twice, but failed both times, as the bulls stepped in to defend that key level. That repeated rejection shows buying pressure is gaining strength, and a momentum shift may be underway.
The Tweezer Bottom becomes even more reliable when it forms at the bottom of a downtrend and is supported by other bullish confluences like increased volume, a known support level, or other reversal candlestick patterns. When confirmed, it often marks the start of a new bullish move.
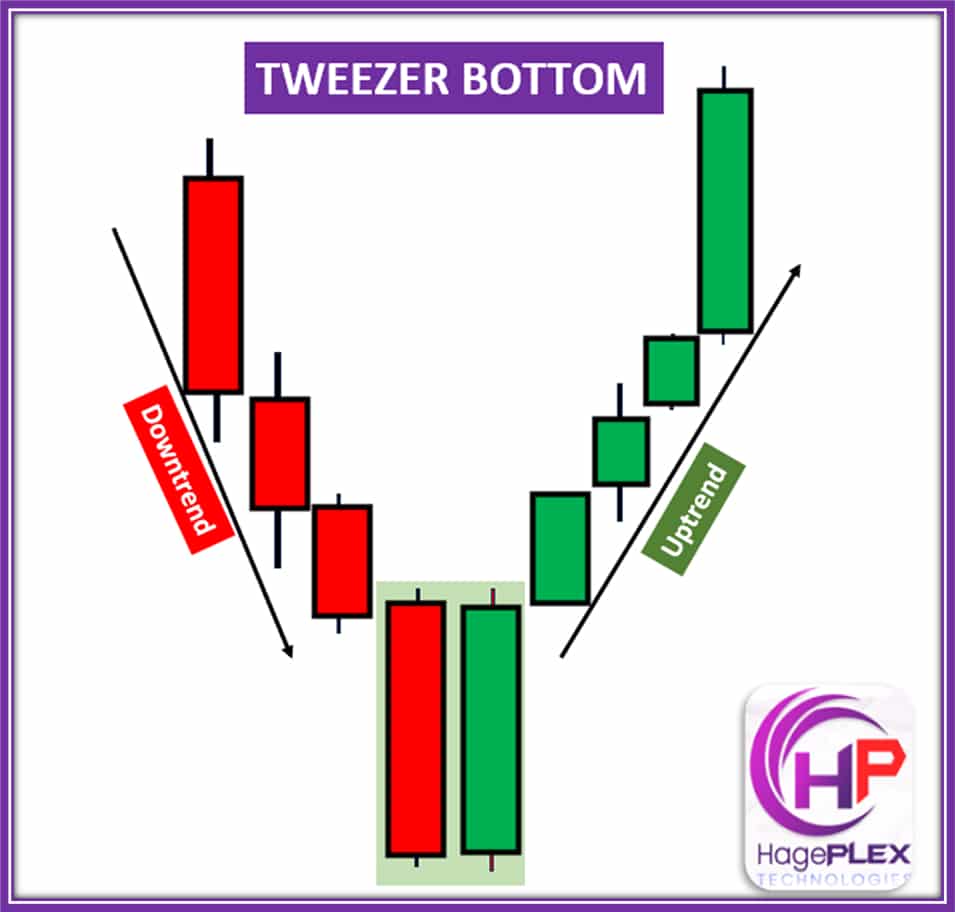
Tweezer Bottom: When the market says, ‘enough is enough!’ Two identical lows mark the turning point — bulls are ready to take the lead.
11. Three Outside Up
The Three Outside Up is a bullish reversal candlestick pattern made up of three candles. It starts with a small bearish (red) candle, showing initial seller pressure. The second candle is a large bullish (green) candle that completely engulfs the body of the first, signaling a strong shift in momentum. Then, the third candle is another bullish candle that closes even higher than the second, confirming buyer strength and commitment.
This pattern tells us that sellers are losing control, and buyers are stepping in with confidence. The engulfing and follow-through bullish candles together show a decisive turn in market sentiment.
The Three Outside Up typically forms at the bottom of a downtrend, near support levels, in demand zones, or after an extended bearish move. It becomes more reliable when confirmed by rising volume or a breakout above a key technical level. When spotted with those confirmations, this pattern often marks the beginning of a new bullish trend.
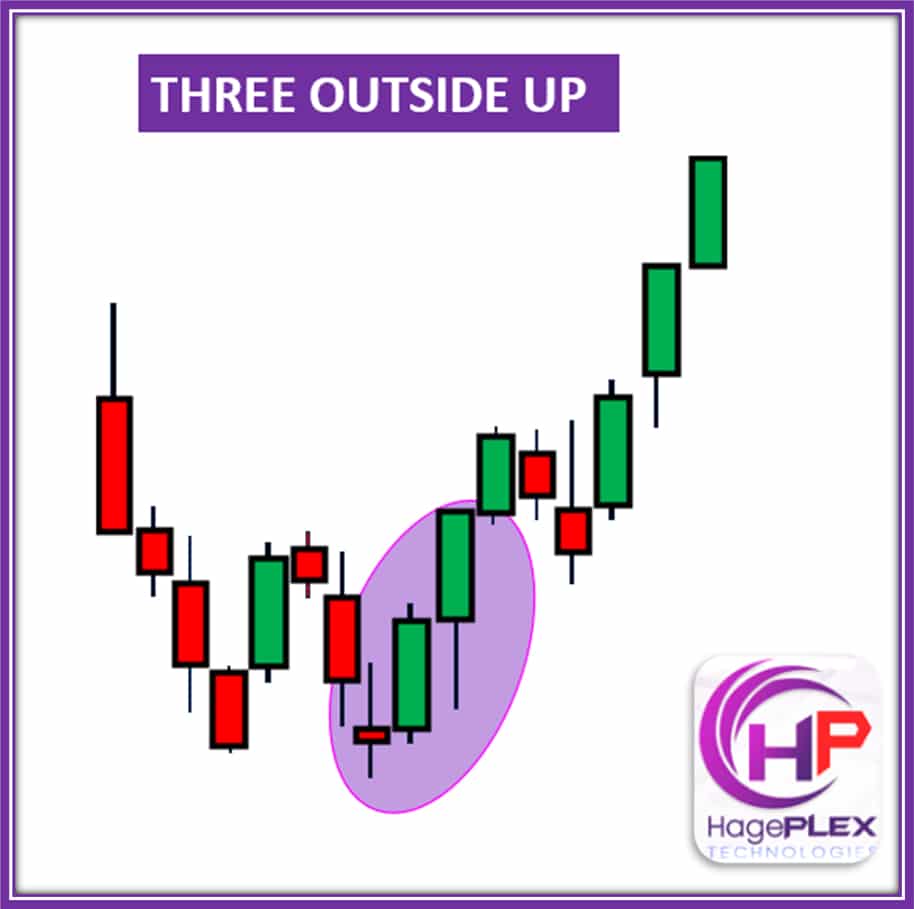
Three Outside Up: Momentum confirmed! A bearish start was reversed and followed by a stronger bullish candle. This is a textbook signal of a bullish takeover.
12. Bullish Kicker
The Bullish Kicker is one of the strongest bullish reversal patterns in candlestick trading. It represents a sudden and aggressive shift in market sentiment — from strong selling to equally strong buying. This shift is often triggered by unexpected news, a major catalyst, or a strong reaction from buyers.
This pattern is made up of two candles. The first is a strong bearish (red) candle, showing heavy selling. The second candle is a powerful bullish (green) candle that opens at or above the previous open, creating a clear gap up. What makes this pattern special is that the second candle completely ignores the bearish move from the first one — it “kicks” against it and heads strongly in the opposite direction.
Because of the intensity and clarity of this reversal, the Bullish Kicker rarely needs confirmation. Once it appears, price often continues upward without hesitation. It’s a clear signal that buyers have taken full control, and that sentiment has decisively flipped.
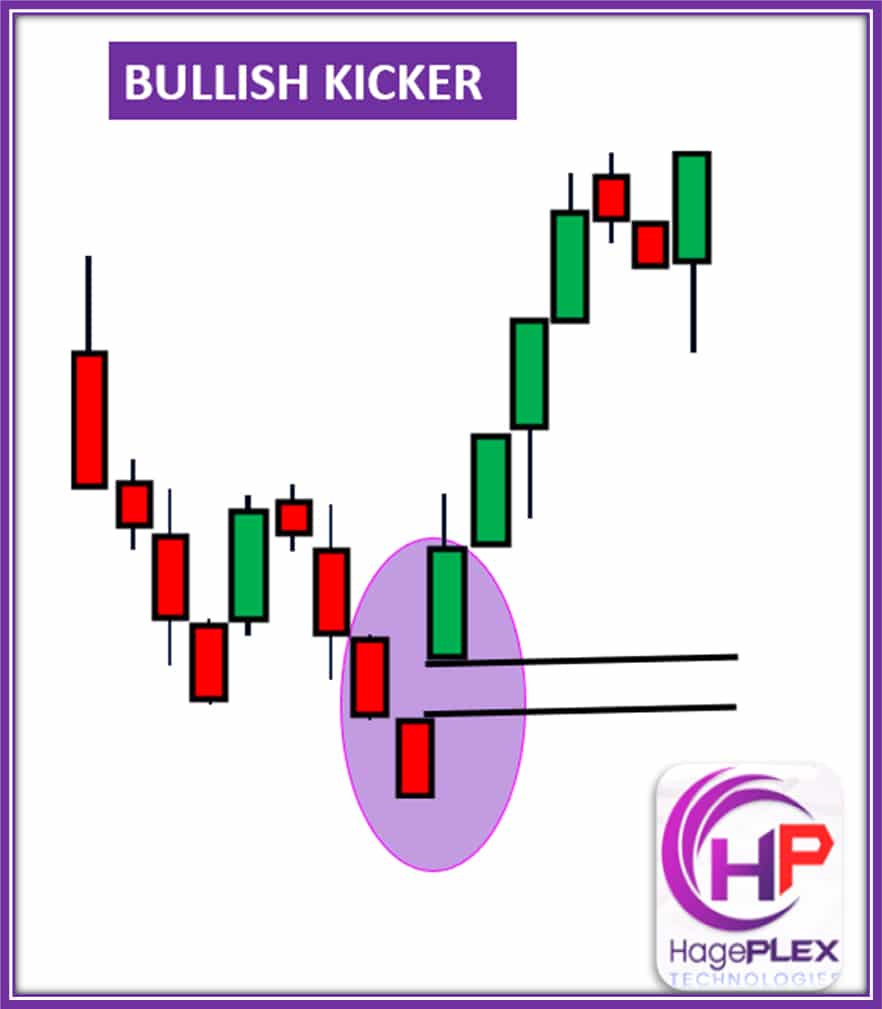
Bullish Kicker: A sudden jolt of buying power! Momentum shifts aggressively as bulls slam into the market, a powerful signal of trend reversal.
13. Inverse Head and Shoulders
The Inverse Head and Shoulders is a well-known bullish reversal pattern that signals a potential change from a downtrend to an uptrend. The pattern is made up of three dips (or troughs) and a neckline that serves as a resistance level. It starts with the left shoulder, where the price drops and then bounces up. Next comes the head, which is a deeper drop that forms a lower low, followed by another bounce. Then the right shoulder forms a smaller dip that makes a higher low compared to the head, showing that sellers are starting to lose momentum.
A key feature of this pattern is the neckline, which connects the two highs between the shoulders and the head. This neckline can be flat or slightly sloped. Once the price breaks above the neckline, it confirms the pattern and signals that buyers are taking control. In short, the Inverse Head and Shoulders tells us that the downtrend is weakening, sellers are running out of steam, and buyers are stepping in with strength, setting the stage for a possible trend reversal to the upside.

Inverse Head and Shoulders: The comeback formation! After deep lows, the market builds a strong base, signaling a major bullish reversal in the making.
14. Upside Tasuki Gap
The Upside Tasuki Gap is a bullish continuation pattern made up of three candles and usually appears during a strong uptrend. The first candle is a strong bullish (green) candle, signaling upward momentum. The second candle is also bullish, and it opens with a gap above the first candle and closes even higher, confirming the strength of buyers.
The third candle is bearish (red). It opens within the second candle’s body and closes lower, partially filling the gap but not closing it completely. This pattern tells us that buyers are still in control, even though there was a brief pullback. The fact that the gap remains partially unfilled is important — it shows that selling pressure is weak and buyers are holding their ground.
Overall, the Upside Tasuki Gap suggests that the uptrend is likely to continue, with the temporary pause or retracement failing to reverse the overall bullish momentum.
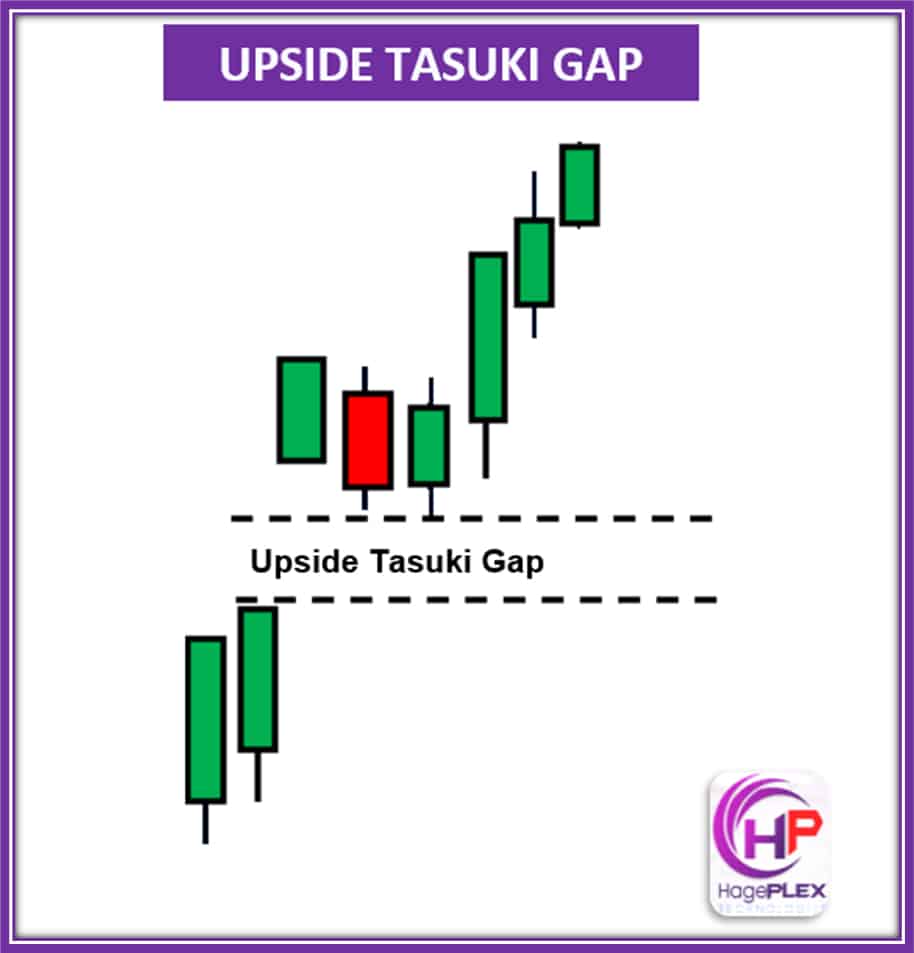
Upside Tasuki Gap: A bullish pause, not a pullback! The gap holds strong as buyers reload — a clear sign of strength in an ongoing uptrend.
15. Double Bottom
The Double Bottom is a bullish reversal pattern that forms after a downtrend and signals a potential shift to the upside. It starts with a first touch, where the price drops to a low and then bounces. After that, the second touch happens — the price falls again, revisits the same low, and bounces back once more. These two lows are usually around the same level, creating a “W” shape on the chart.
Between these two touches, there’s a swing high, and a neckline is drawn across that level. This neckline acts as resistance. What makes the Double Bottom significant is that the second low holds, showing that sellers were unable to push the price any lower. This indicates reduced selling pressure and growing interest from buyers. When the price finally breaks above the neckline, it confirms the pattern and signals a potential trend reversal to the upside. It’s a sign that sellers have likely lost control, and buyers are stepping in with confidence.

Double Bottom: The market hits rock bottom twice — and bounces back stronger! A classic bullish reversal setup signals the end of selling pressure.
16. Ladder Bottom
The Ladder Bottom Candlestick Pattern is a strong bullish reversal signal. It usually forms at the end of a downtrend, often near major support levels or after a period of heavy selling pressure.
This pattern is made up of five candles. The first three are long bearish (red) candles. They show strong, aggressive downward momentum. Then comes the fourth candle — a small-bodied one. It can be red or green, but more importantly, it signals indecision or slowing momentum.
The fifth and final candle is the star of the show. It’s a strong bullish (green) candle that closes above the high of the fourth candle. This final move confirms that the bulls are back in control.
Why is it important? The pattern tells us that sellers are losing steam, and buyers are stepping in with real conviction. The final candle seals the deal, suggesting a trend reversal may be underway.
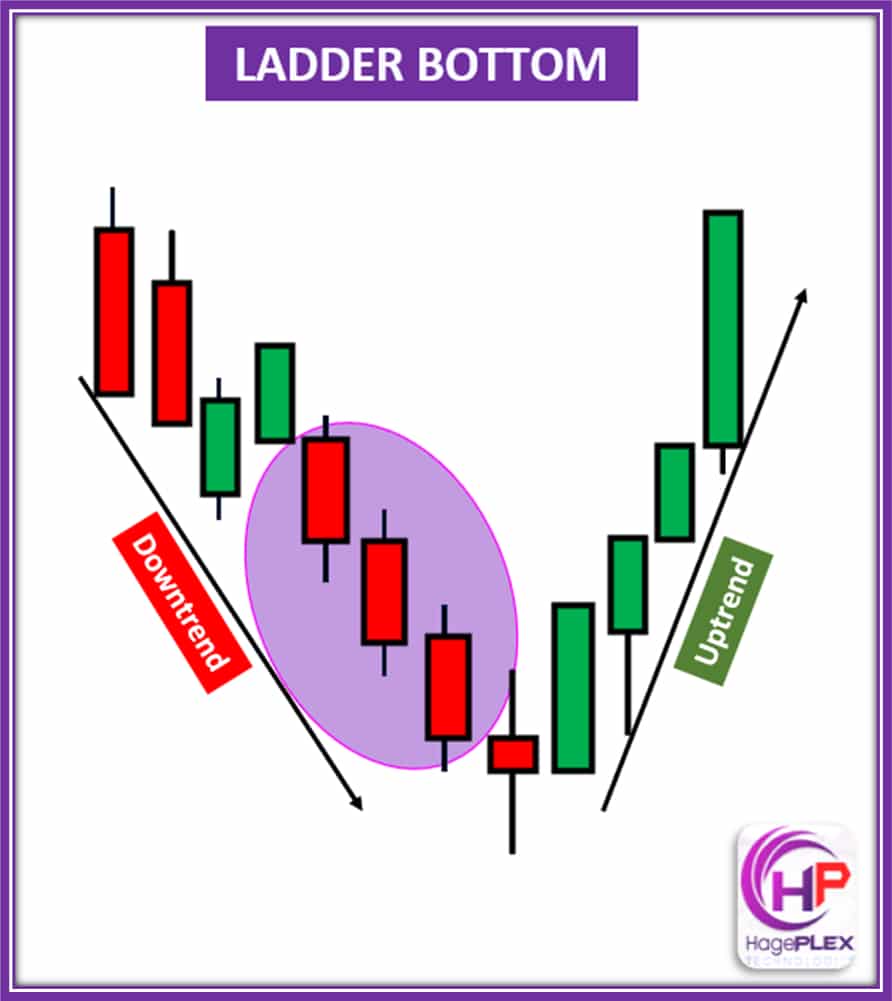
Ladder Bottom – Five-candle bullish reversal showing weakening bearish momentum and strong buyer comeback.
17. Bullish Stick Sandwich
The Bullish Stick Sandwich is a unique three-candle pattern that can signal either a bullish continuation or reversal, depending on the context. It often appears in an uptrend, near support zones, or right after a short-term dip within a larger bullish move.
The structure is simple but deceptive. The first candle is bearish (red) — sellers drive the price down. The second candle is a small bullish (green) one, showing a bit of indecision or a weak bounce. Then comes the third candle, another bearish (red) one that closes around the same level as the first.
This forms a visual “sandwich” — two red candles with a green one in between. While it might look bearish at first glance, the pattern actually shows resilience. Despite two bearish pushes, the price doesn’t break lower. Buyers are quietly absorbing the pressure.
In a bullish context, this tells us something important: the bears tried twice to break support and failed. The green candle in the middle may be a trap — luring in shorts or shaking out weak buyers. But when price holds or starts to climb after the pattern, it confirms the underlying bullish intent.
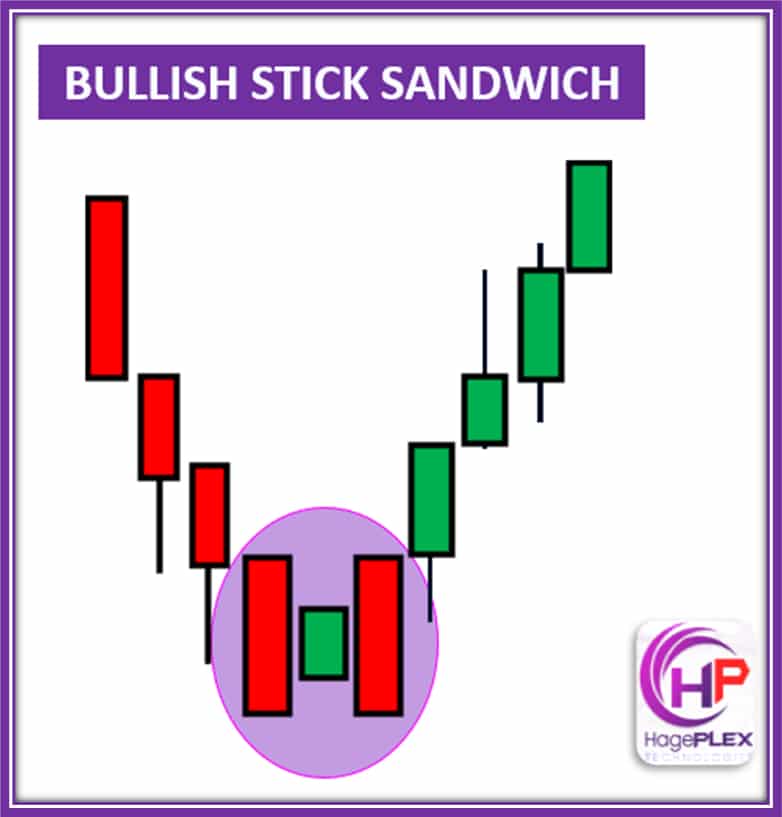
Bullish Stick Sandwich – A three-candle pattern signaling strong support, with buyers defending the same price level twice.
18. Bullish Mat Hold
The Bullish Mat Hold Pattern is a classic bullish continuation signal, often seen during a strong uptrend. It usually shows up right after a breakout or impulsive bullish move and sometimes near a key resistance-turned-support level.
The structure begins with a strong bullish candle, representing a burst of buying momentum. Then comes a pause — 2 to 3 smaller candles, usually bearish or neutral. These candles stay within the range of that first big candle, showing a period of consolidation without real selling strength. Finally, a breakout candle appears — another strong bullish candle that closes above the high of the first one. That’s your confirmation.
What makes this pattern powerful is how it shows buyers taking a controlled breather. The market pauses, but it doesn’t break down. Sellers try to push the price lower, but they fail to break the support level. Instead of a reversal, we get a bullish continuation. Think of it like a mini bull flag — but in candlestick form.
This pattern tells traders that bulls are still in charge, absorbing minor selling pressure and preparing for another leg up. The breakout candle signals the renewed bullish momentum, and smart traders often aim for a measured move, using the height of the first candle and projecting it from the breakout point.
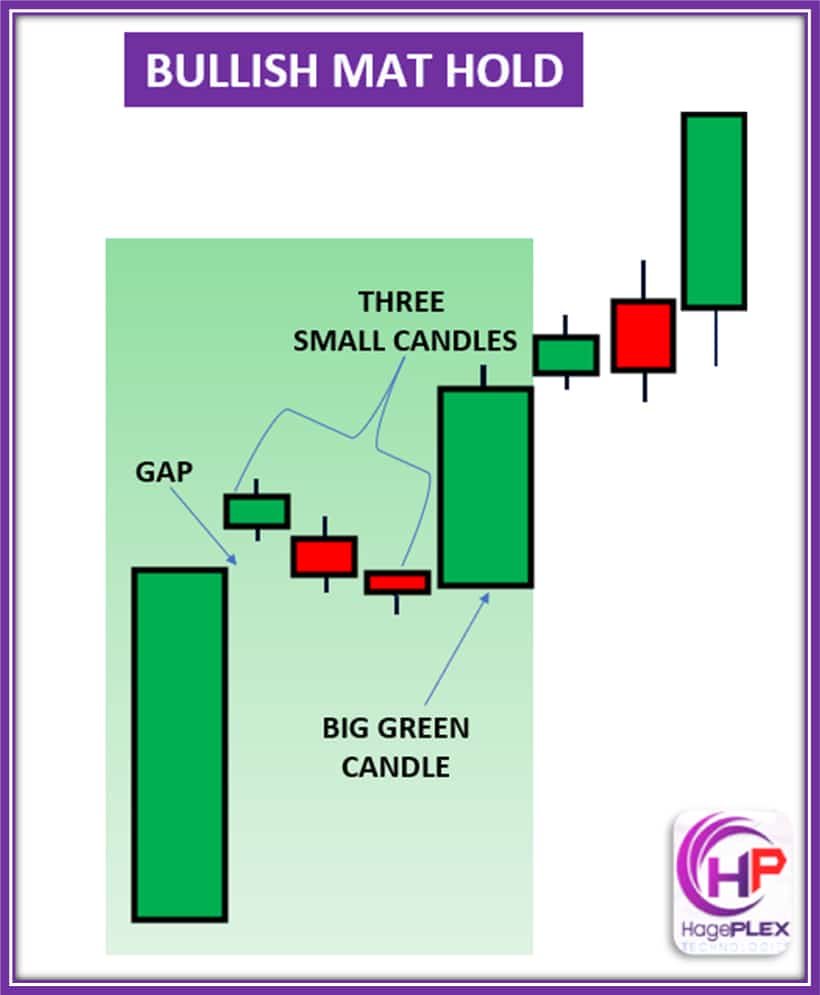
Bullish Mat Hold – A bullish continuation pattern showing a brief pause before the uptrend resumes with strong momentum.
19. Bullish Counter Attack
The Bullish Counter Attack Pattern is a bullish reversal signal that appears at the bottom of a downtrend, typically after a period of heavy selling pressure. You’ll often spot it after a long red candle when it seems like the bears are fully in control — but that’s when the surprise comes.
This pattern forms with two key candles. First, a strong bearish candle that closes near its low, clearly showing that sellers have the upper hand. Then, the counterattack begins — a strong bullish candle immediately follows, opening at or near the same level as the bearish candle’s close. It then closes deep into the previous candle’s body, ideally near or at the same level where the first candle opened.
What makes this pattern stand out is the almost identical open price of both candles. It visually demonstrates how buyers aggressively pushed back against the selling, basically saying, “Not so fast!” This sharp rejection of lower prices hints that the downtrend may be exhausted.
The pattern is even more powerful if it forms near a known support zone or after oversold conditions. It signals a potential shift in sentiment, where buyers regain control and possibly kick off a strong rally.
Traders typically wait for confirmation, like a breakout above a recent resistance or continuation in volume, before fully committing to a long position.
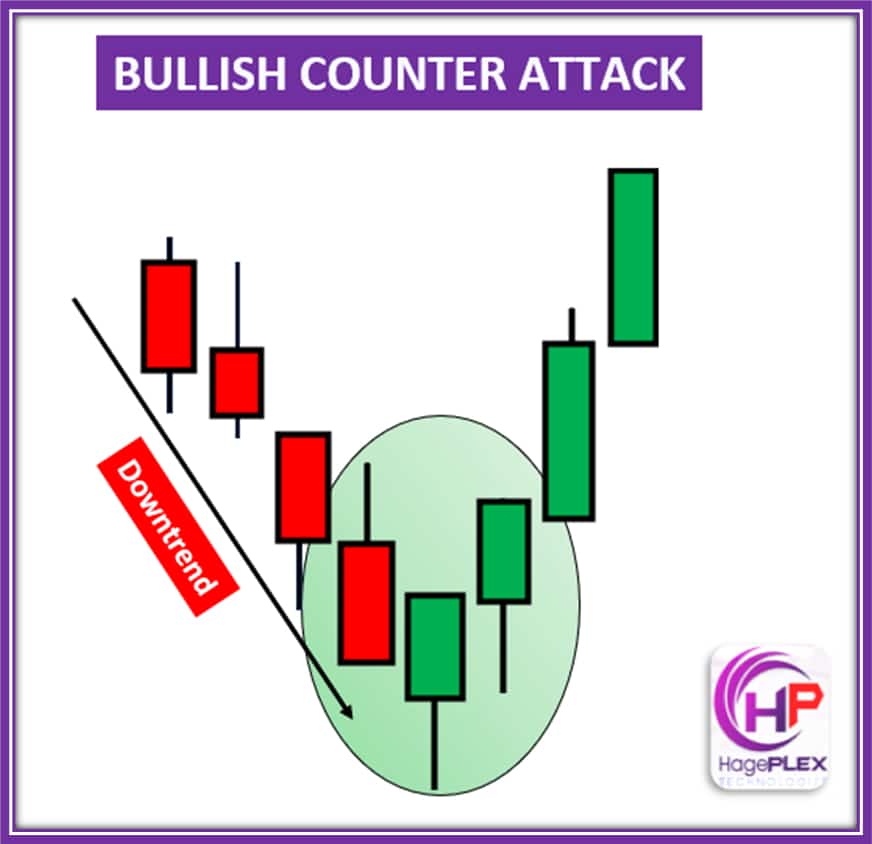
Bullish Counterattack – A two-candle reversal pattern where buyers strongly push back after a bearish candle, signaling a potential shift in momentum.
20. Bullish Matching Low
The Bullish Matching Low is a bullish reversal pattern that shows up during a downtrend, often near strong support zones or after a market becomes oversold. It’s a subtle yet powerful sign that the selling pressure may be fading.
This pattern forms with two candles. The first is a strong bearish candle that closes near its low — a typical sign of bearish control. The second candle also ends with a close at or near the same level as the first. This repetition creates a “matching low”, which acts like a price floor — a point where buyers are quietly stepping in.
This price match suggests that bears are losing steam, and bulls could be preparing to take over. However, it’s important to remember: this pattern needs confirmation. Without a bullish candle or a clear move upward next, it could just be a pause in the downtrend.
To trade it smartly, many traders wait for a bullish confirmation candle or a spike in volume after the pattern forms. Entries are usually placed above the high of the second candle, with a stop loss set just below the matching lows. A reasonable target would be the next resistance level, or aim for at least a 1:2 risk-to-reward ratio.
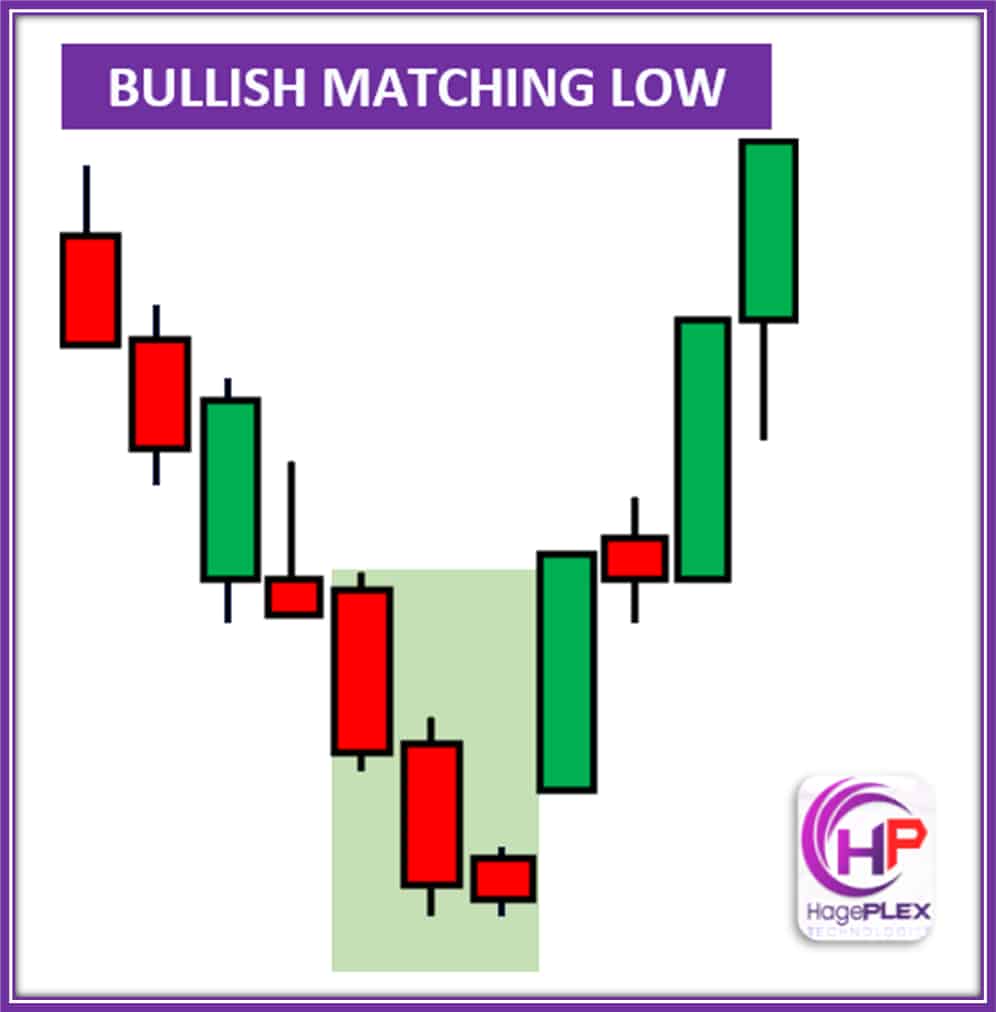
Bullish Matching Low – A bullish reversal pattern formed by two candles with equal lows, signaling strong support and a potential price bounce.
21. Bullish High Wave
The Bullish High Wave is a candlestick that often signals a potential reversal in a downtrend or represents indecision during consolidation. It tends to appear after a strong bearish move, especially around key support zones or oversold conditions, when the market is hinting at a shift.
This candle has a small real body (either bullish or bearish) and long upper and lower shadows, giving it a dramatic appearance — like a stretched-out spinning top or a long-legged doji. This structure shows that both buyers and sellers fought hard, but neither truly won. Prices swung in both directions before settling close to where they opened.
In a downtrend, this kind of candle tells you that bears tried to push prices lower but failed, and at the same time, bulls stepped in to defend the lows. It’s a visual clue that the selling momentum is weakening, and a possible trend shift or pause could be coming.
But don’t rush in just yet — the Bullish High Wave needs confirmation. A strong bullish candle afterward or a spike in buying volume helps validate the reversal. A smart entry would be above the high of the high wave candle, with a stop loss below the low, and a target set at the next resistance level or using a 1:2 risk-to-reward ratio.
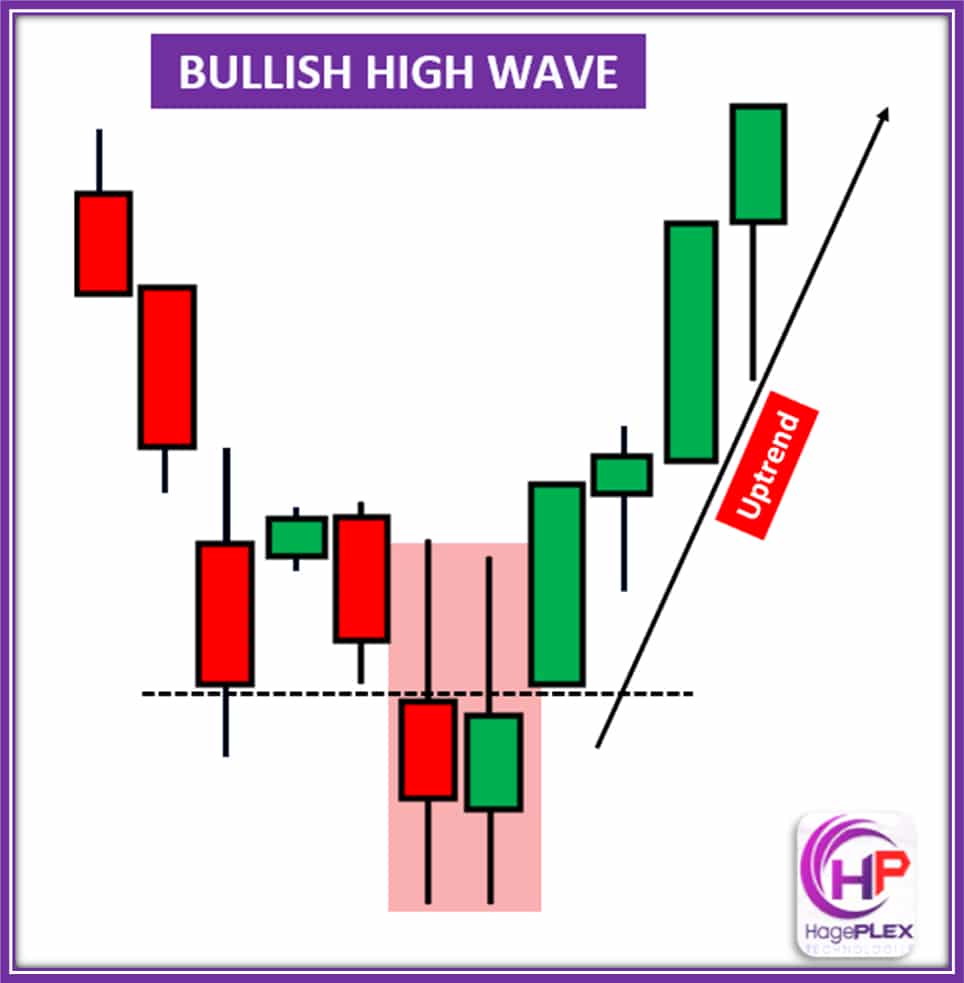
Bullish High Wave – A candlestick pattern with a small body and long wicks on both sides, indicating indecision, but the price closes higher, signaling potential bullish momentum.
22. Bullish Marubozu
The Marubozu candlestick is a bold, no-nonsense candle that signals strong momentum in the market. You’ll spot it at the start of a breakout, during a trend continuation, or right at key levels like support and resistance zones. What makes a Marubozu stand out? It has a full body with no wicks—or barely any. This means the price moved in one direction from open to close without much hesitation.
There are two types: the Bullish Marubozu (opens at the low, closes at the high) shows buyers were in full control. The Bearish Marubozu (opens at the high, closes at the low) tells you sellers dominated the session. Either way, this candlestick screams confidence and commitment from whichever side is in charge.
Marubozu candles are powerful tools for traders — they can confirm a breakout, validate a trend’s strength, or act as a launchpad for entries, especially when they form near important price zones.
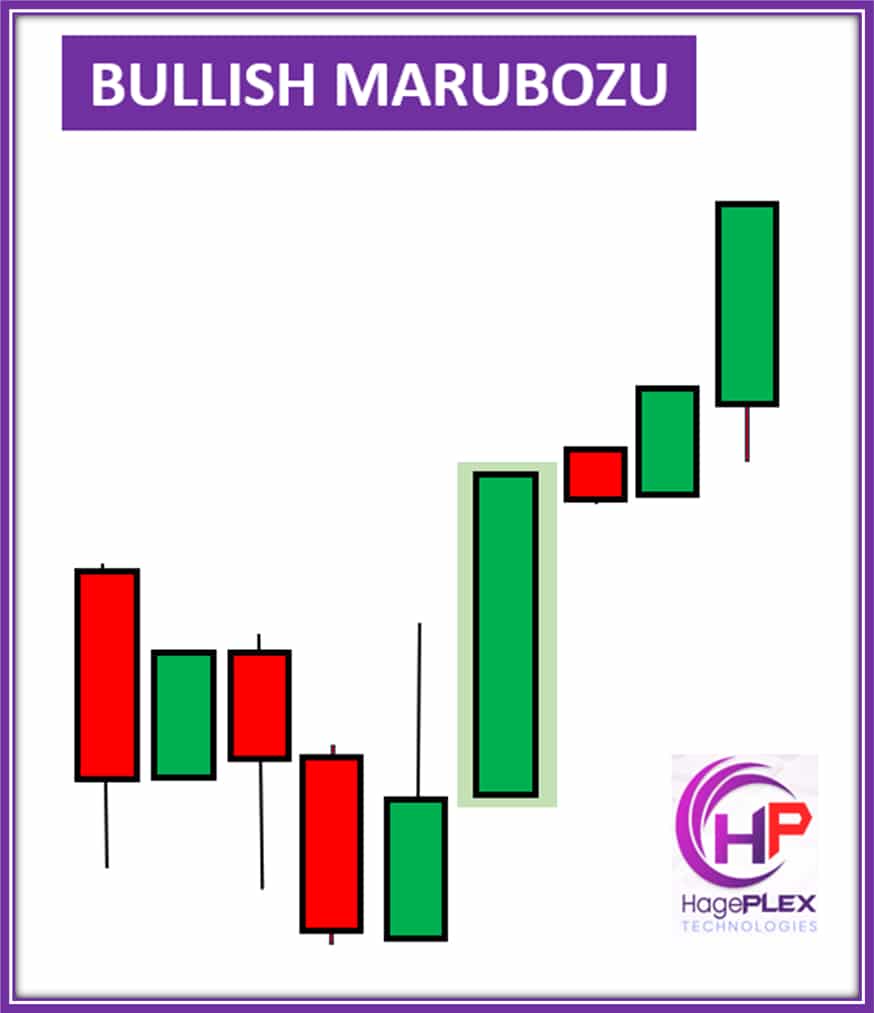
Bullish Marubozu – A strong candlestick pattern with a long body and no wicks, indicating that buyers are in full control throughout the session, signaling a strong bullish trend.
23. Bullish Open Marubozu
The Bullish Open Marubozu is a strong candlestick that signals serious buying momentum. It forms when the price opens at the low (with no lower wick) and climbs steadily throughout the session, closing much higher. While it might have a slight upper wick, the message is clear—buyers dominated from the first tick. You’ll often see this pattern at the end of a downtrend (hinting at a bullish reversal) or during an uptrend (confirming continuation). It typically shows up near support zones or after a period of consolidation. This candle tells traders that bears are losing control, bulls are confident, and more upside could be coming—especially when it’s backed by strong volume or breaks key levels. Traders often enter on a break above the high, set stops at the low, and aim for the next resistance level or use a solid risk-reward ratio.
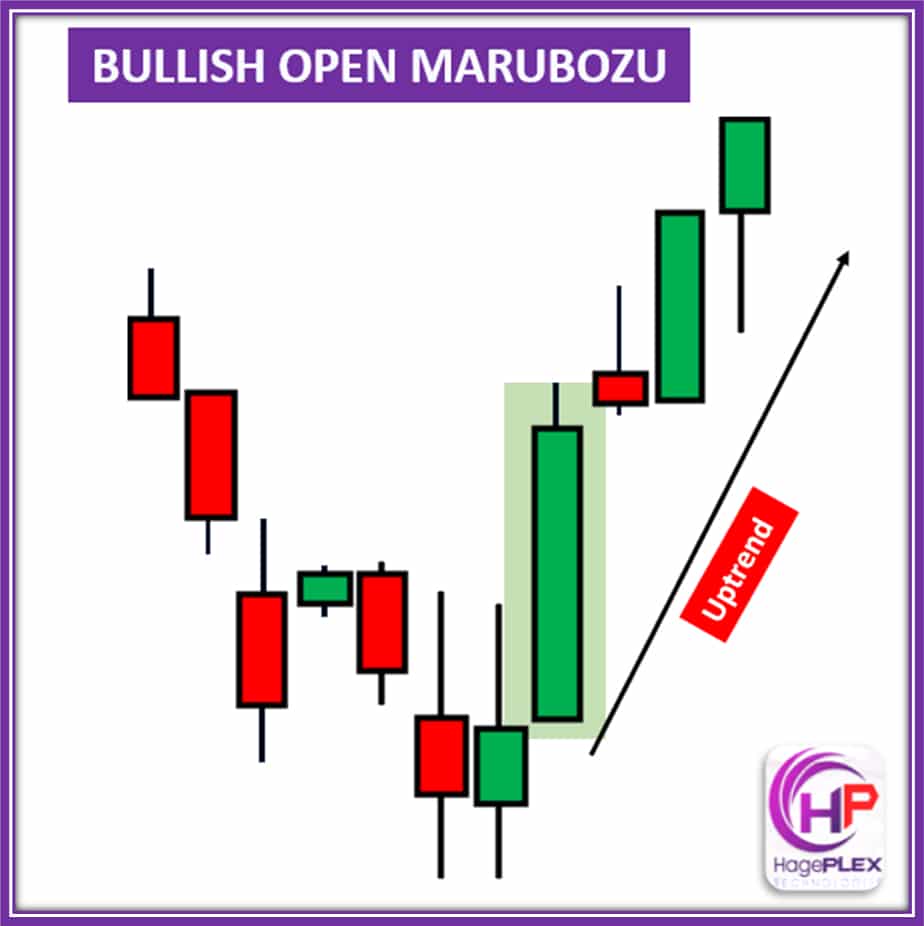
Bullish Open Marubozu – A candlestick pattern with a long body, where the price opens at the low and closes at the high, showing strong bullish momentum from the start of the session to the close.
24. Bullish Close Marubozu
The Bearish Close Marubozu is a powerhouse candlestick that screams strong selling pressure. It forms when the price opens and then falls relentlessly, closing right at the session’s low, with no lower wick. Sometimes you’ll spot a small upper wick, which just shows that buyers tried early on… but the bears completely took over. This pattern shows up in a downtrend to confirm momentum or after a rally to signal a potential reversal, especially near resistance zones or breakdown levels. It tells traders the bulls have been crushed, and sellers are fully in control. The clean close at the low signals that more downside could follow. When backed by high volume or confirmation tools like MACD or RSI, it becomes even more powerful. Traders often enter short just below the candle’s low, with a stop above the high, and aim for the next support level or apply a solid risk-reward setup.
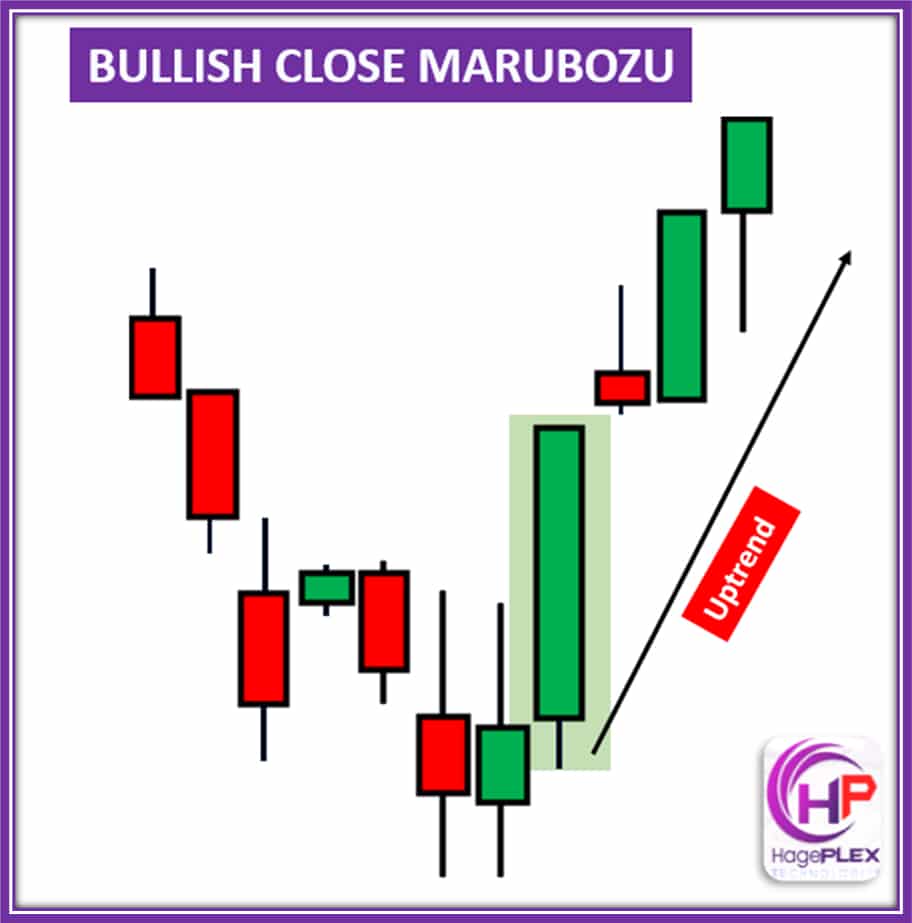
Bullish Close Marubozu – A candlestick pattern with a long body, where the price opens at the high and closes at the low, indicating strong bullish momentum that holds through the session, showing little to no retracement.
25. Bullish Full Marubozu
The Bearish Full Marubozu is as bearish as it gets — a long, solid red candle with no wicks at all. That means the price opened at the high and closed at the low, with zero buyer pushback throughout the session. It’s pure seller domination from start to finish. You’ll often spot this beast after a strong uptrend, signaling a reversal, or in the middle of a downtrend, reinforcing the momentum. It can mark panic selling, a breakdown, or simply a collapse in buyer confidence. If it appears at resistance, or alongside a spike in volume, it’s a loud warning: the bears are here. Traders usually jump in short below the candle’s low, place a stop above the high, and aim for the next major support zone or set up a measured move. Look for extra confirmation from RSI, MACD, or a strong follow-up bearish candle.
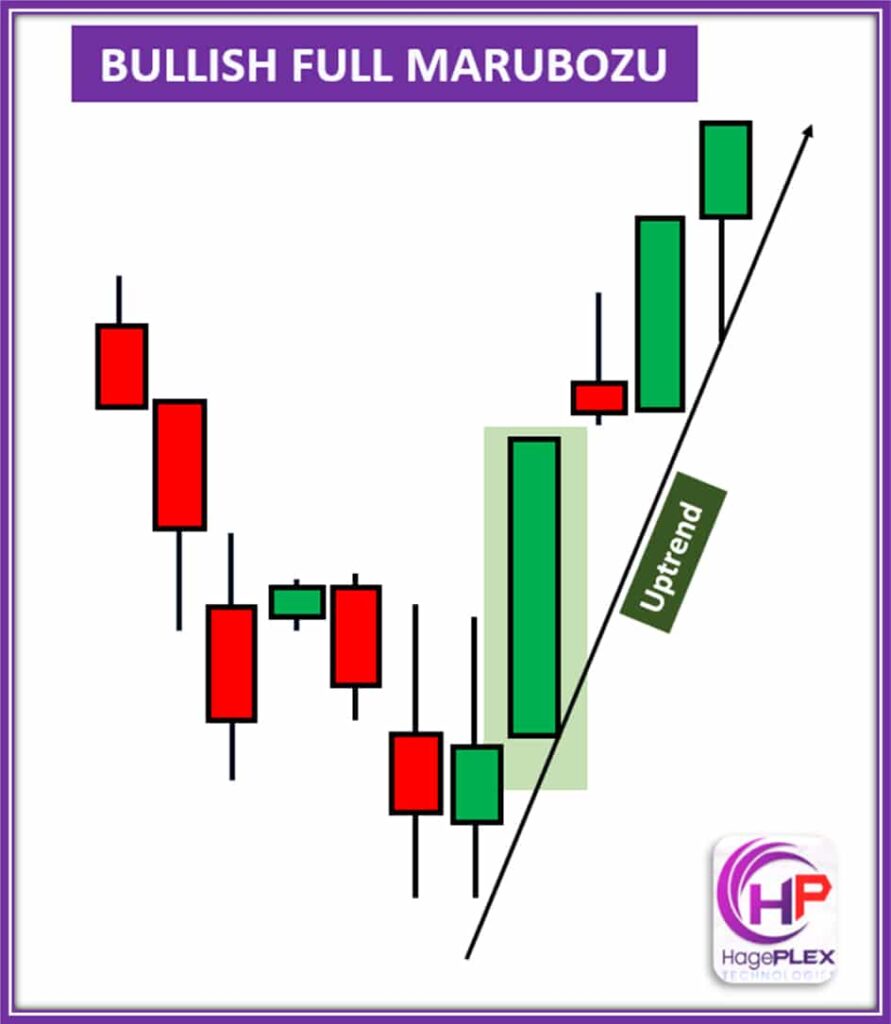
Bullish Full Marubozu – A strong candlestick pattern where the price opens at the low and closes at the high, with no wicks or shadows.
26. Bullish Concealing Baby Swallow
A rare but powerful pattern where two or more downward candles are “swallowed” by a bullish candle, showing aggressive buying after a false bearish breakdown. The Bullish Concealing Baby Swallow marks the end of a sharp downtrend and signals a strong buying takeover. It starts with two big bearish candles, showing sellers in control, but their momentum falters. The third candle, often a small body, indicates indecision. This is followed by a large bullish candle that “swallows” the previous candles, confirming the shift to bullish sentiment. The pattern visually shows exhaustion in the sell-off and the start of an uptrend. When it appears near support zones, during oversold conditions, or with a volume surge, it’s an even stronger signal. Traders typically enter above the high of the bullish candle, set a stop below the low of that same candle, and target resistance zones or Fibonacci levels. Extra confirmation might come from volume or RSI indicators.
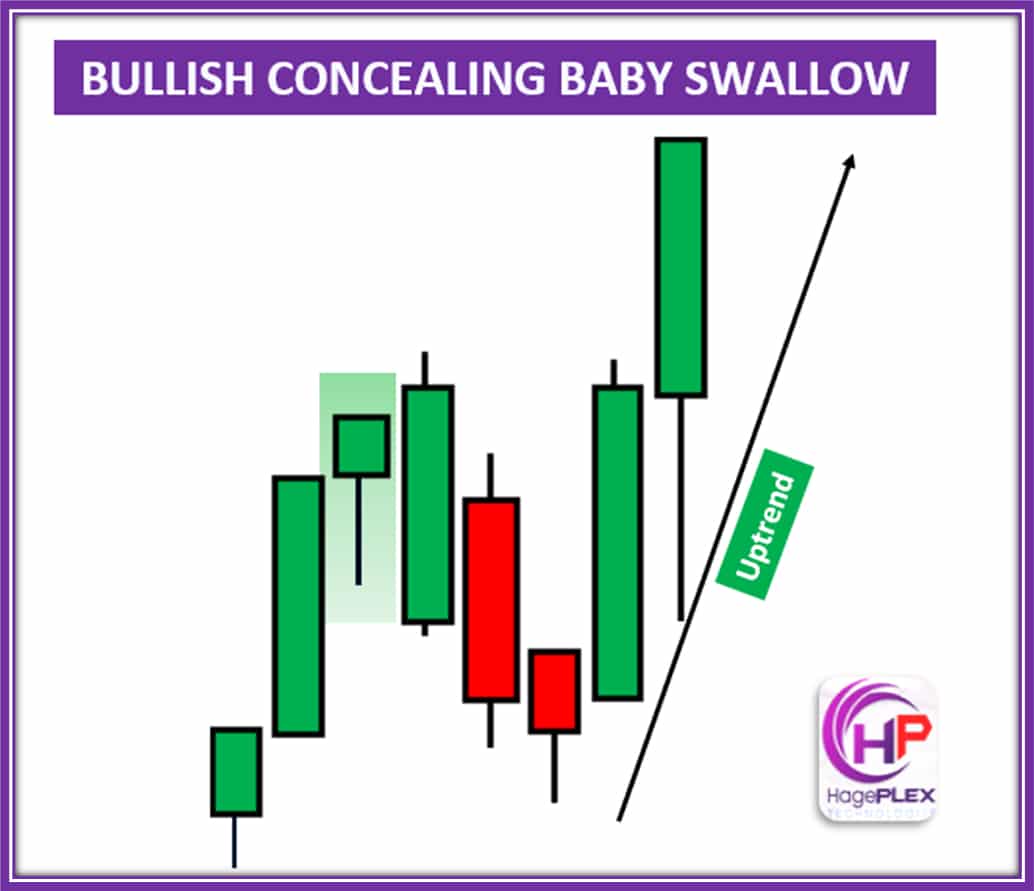
Bullish Concealing Baby Swallow – A three-candle pattern where a small bearish candle is followed by a larger bullish candle that engulfs it, signaling a potential bullish reversal.
27. Bullish Advanced Block
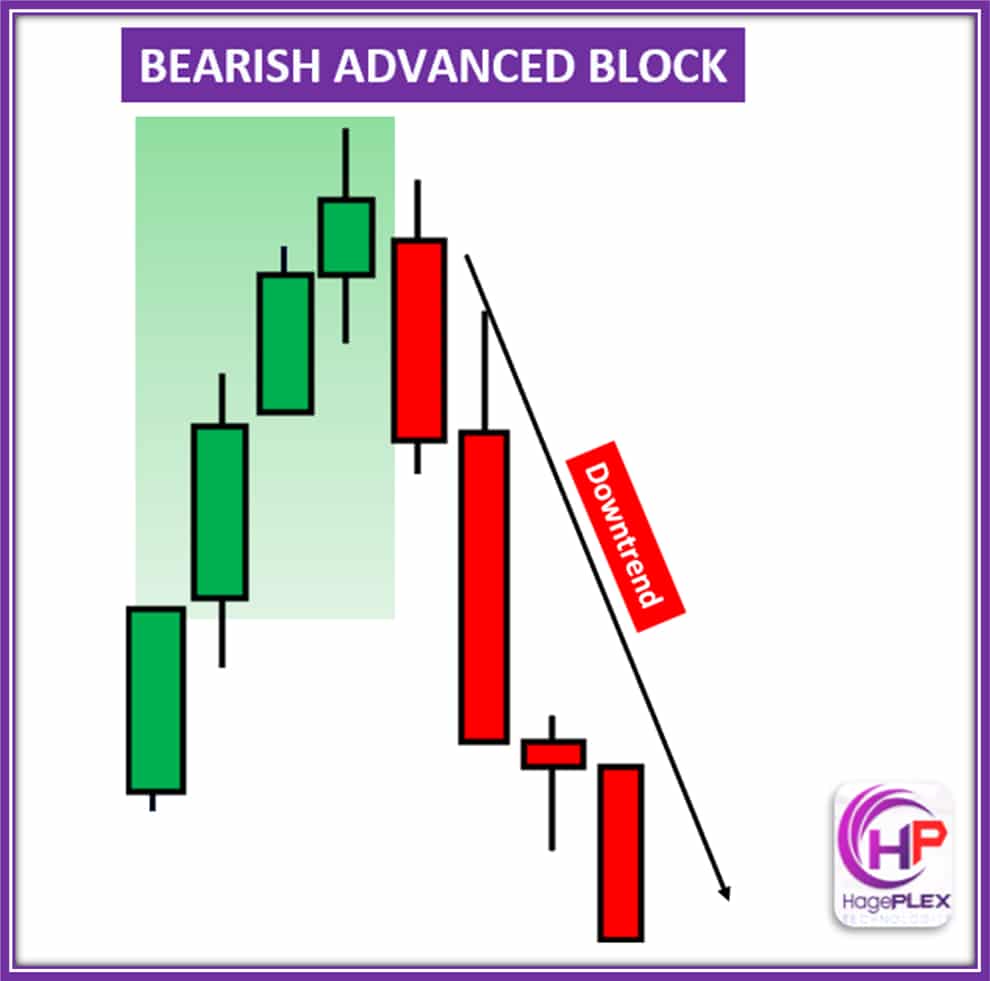
The Bearish Advanced Block signals the potential end of an uptrend and the beginning of a bearish reversal. It forms as the bullish momentum weakens toward the end of a strong rally, often near resistance zones or overbought conditions. The first candle shows strong bullish momentum, but the second one is smaller, indicating hesitation. The third candle is even smaller, often a doji or a small bullish candle with a long upper wick, signaling resistance and diminishing buying strength. This pattern shows that buyers are losing momentum, while sellers are starting to absorb the buying pressure. It often appears as a warning sign that the uptrend is weakening. Traders typically enter below the low of Candle 3, set a stop above its high, and target support zones or Fibonacci levels. Extra confirmation can come from RSI divergence, declining volume, or a bearish engulfing candle following the pattern.
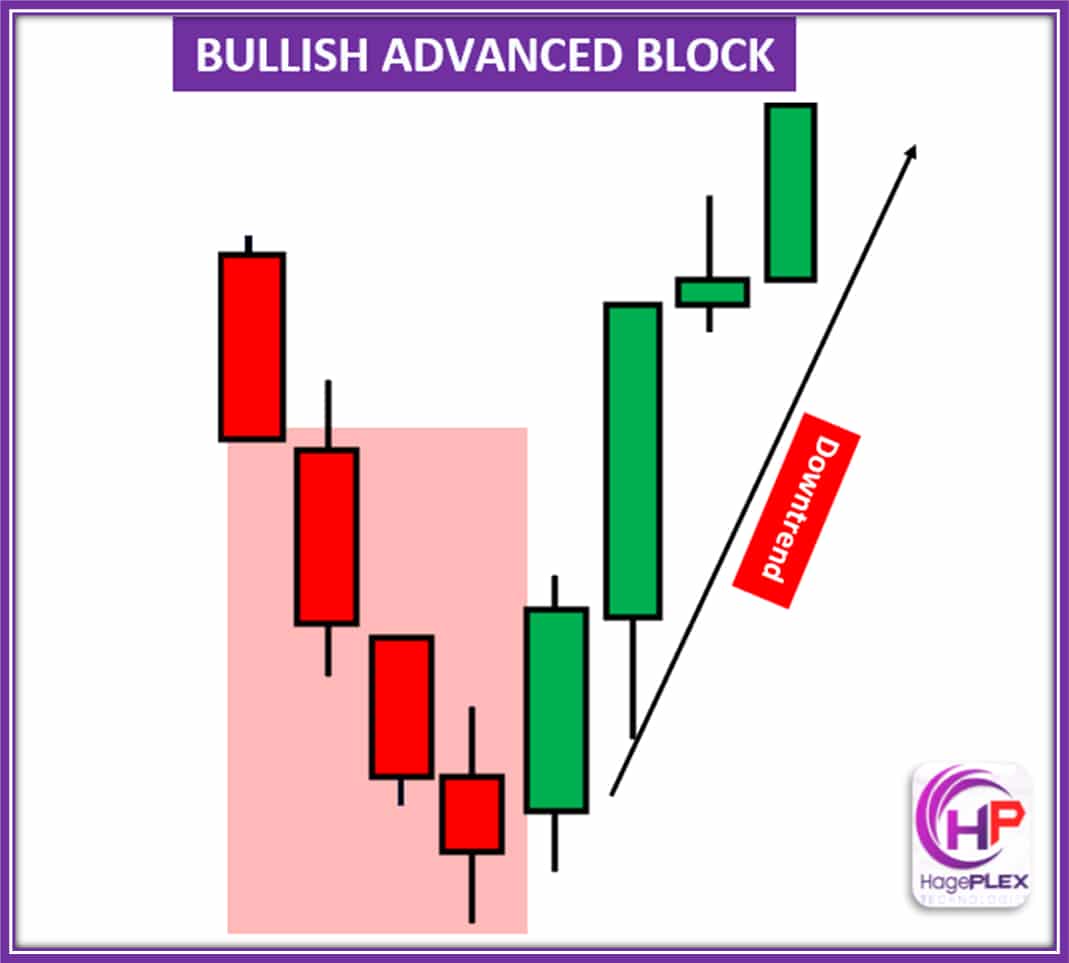
Bullish Advanced Block – A three-candle pattern where a bearish candle is followed by two consecutive bullish candles, indicating a potential continuation of the uptrend after a brief pullback.
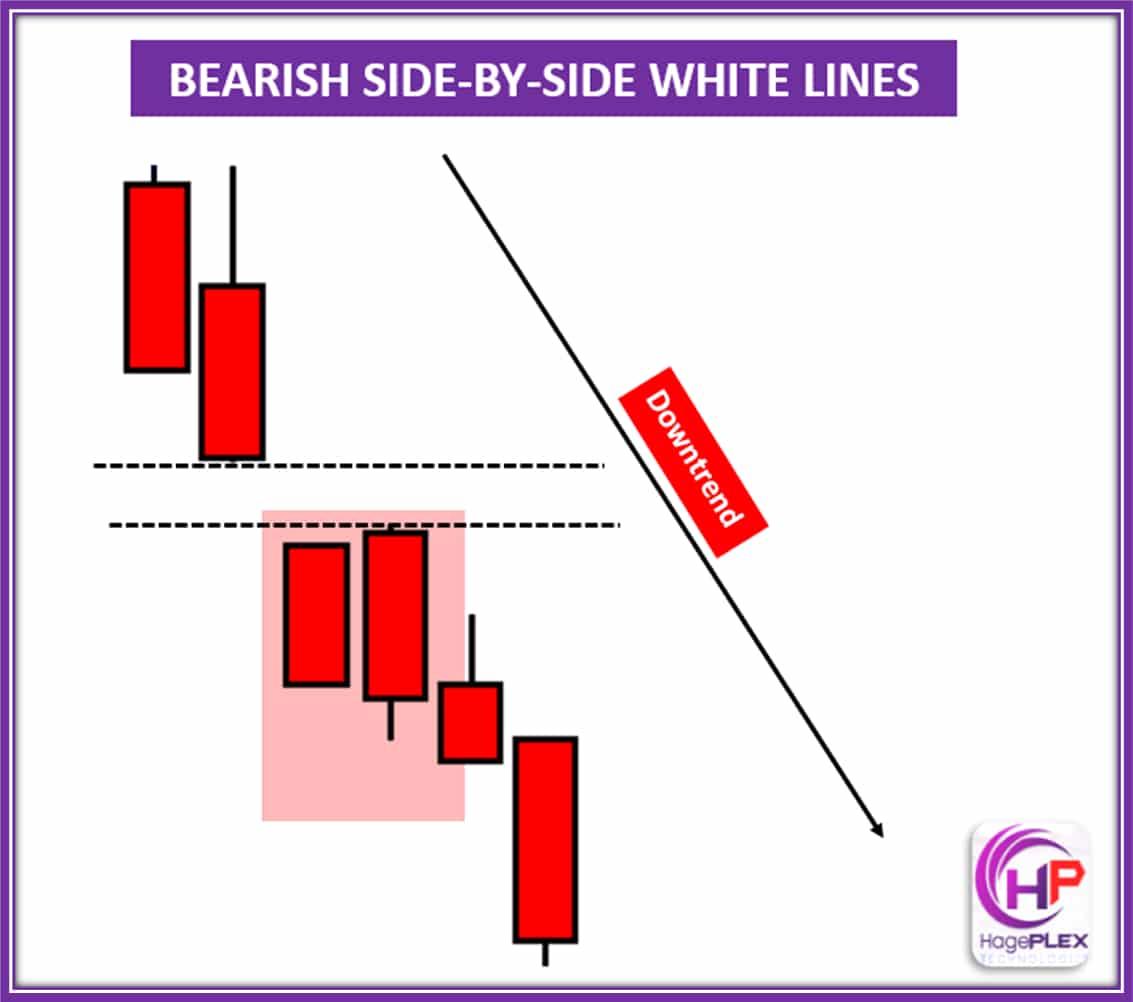
28. Bullish Side-by-Side White Lines
The Bullish Side-by-Side White Lines is a bullish continuation pattern that shows steady buyer confidence and a sustained upward trend. It typically forms midway through an ongoing uptrend, following a breakout or a strong bullish candle. It can also appear near support zones or in markets that are trending with shallow pullbacks. The pattern consists of three bullish candles, all similar in size and structure. The first candle is a strong bullish candle, often after a breakout. The second candle gaps up slightly, continuing the upward momentum, and the third candle forms at or near the same price level as the second, creating a smooth, orderly pattern with minimal wicks.
What this pattern tells you is that buyers are firmly in control, confidently pushing the price higher without any interruption from sellers. The structure reflects a consistent trend with little volatility, visually resembling a “step-up” in price. This pattern indicates smooth bullish continuation, with no signs of resistance from bears.
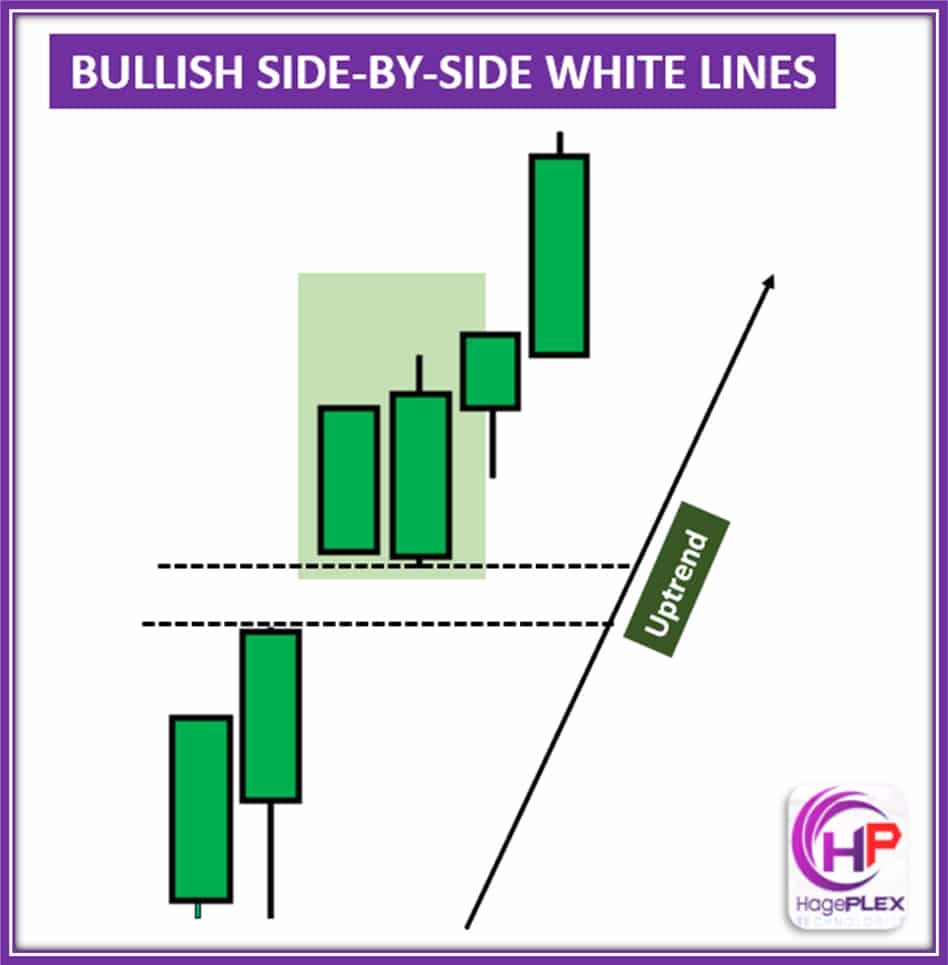
Bullish Side-by-Side White Lines – A two-candle pattern where two consecutive long bullish candles appear side by side, signaling strong buying pressure and potential continuation of the uptrend.
29. Bullish Separating Line
The Bullish Separating Line is a bullish reversal pattern that signals a potential shift from bearish to bullish, often following strong seller exhaustion. This pattern typically forms during a downtrend or consolidation phase, particularly after a brief bearish rally or pullback. It is especially significant when found near key support levels or after the market has been prolonged in oversold conditions.
The structure consists of two candles:
Candle 1: A bearish candle that continues the downtrend.
Candle 2: A bullish candle that opens at the same price as Candle 1 and closes significantly higher, effectively separating the previous bearish movement with a strong bullish reversal.
The key feature of this pattern is that the open price of both candles is nearly identical, creating a “separation” between the previous downtrend and the upcoming upward movement.
What it tells you is that sellers have lost control, and buyers are stepping in strongly. The downtrend is weakening, and a potential uptrend could be on the horizon. The bulls are rejecting lower prices, signaling that bullish momentum is building. This pattern is more reliable when it forms at key support levels, trendlines, or after a period of oversold conditions.
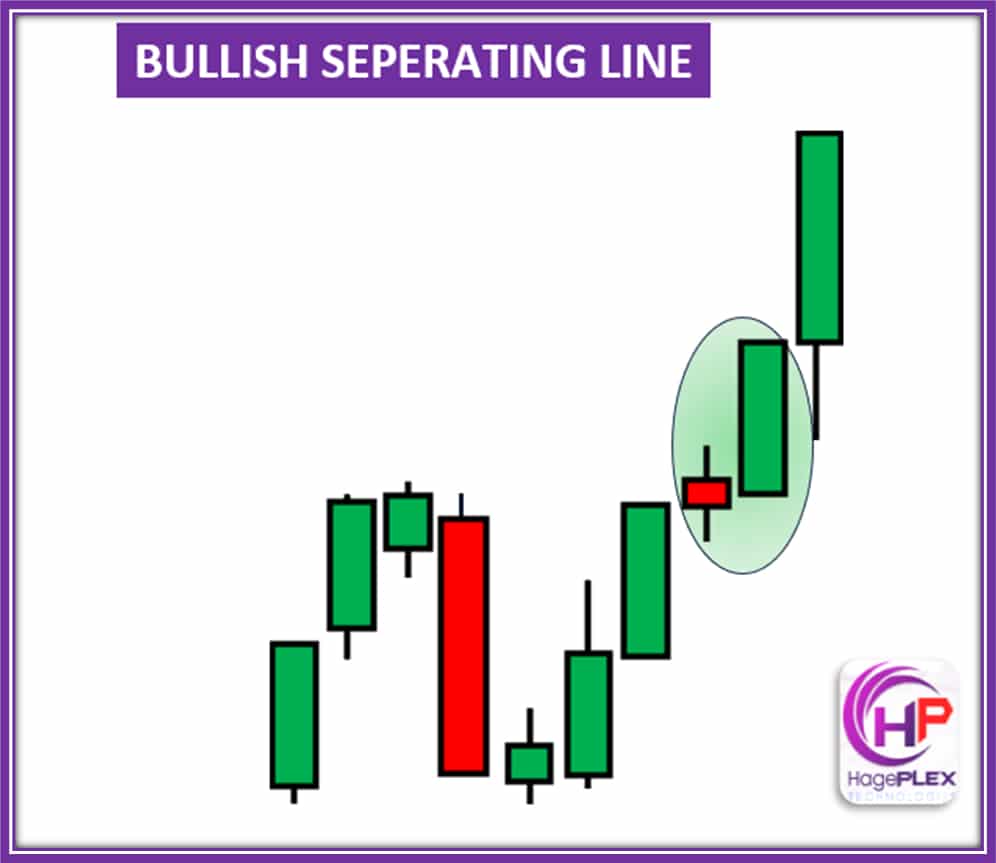
Bullish Separating Line – A two-candle pattern where the first candle is bearish, followed by a bullish candle that opens at the previous candle’s close, signaling a potential reversal from bearish to bullish momentum.
30. Three White Soldiers
The Three White Soldiers is a bullish reversal or strong continuation pattern, signaling that buyers have fully taken control after a downtrend or consolidation. It typically forms at discount zones, support levels, or after a price retest, indicating that the market is ready to move upward.
This pattern consists of three candles:
First Candle – A bullish candle that closes strongly near its high.
Second Candle – Opens within the first candle’s body and closes higher.
Third Candle – Opens within the second candle’s body and closes even higher.
The key feature of the pattern is that each candle closes near its high, with higher highs and higher lows. The candles have small or no wicks, showing strong buyer control throughout the formation.
What it tells you is that buyers have taken full control of the market. The pattern indicates a likely trend reversal to the upside, and it can also serve as a trend continuation signal if formed mid-trend.
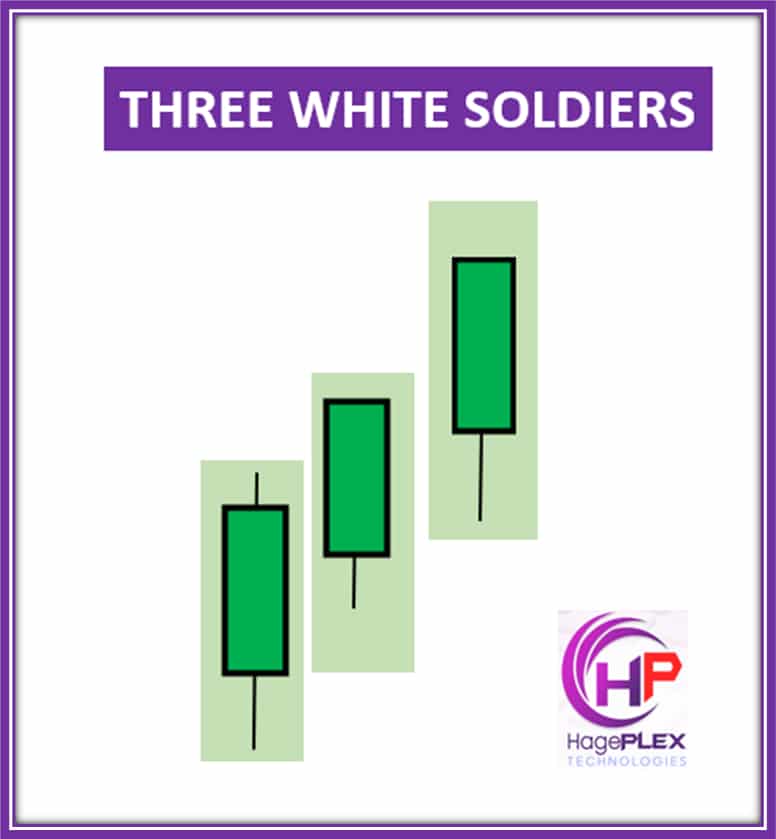
Three White Soldiers – A bullish reversal pattern consisting of three consecutive long green candles, each closing higher than the previous one, signaling strong buying momentum and the potential start of an uptrend.
31. Three Rising Methods
The Three Rising Methods is a bullish continuation pattern that signals the resumption of upward momentum after a brief consolidation. It typically forms in the middle of an uptrend, often after a bullish impulse move or near key support levels.
The pattern consists of:
First Candle – A strong bullish candle that sets the tone.
Second to Fourth Candles – 2 to 3 smaller bearish or neutral candles that stay within the range of the first candle, showing a brief consolidation or pullback.
Last Candle – A large bullish candle that closes above the high of the first candle, confirming the resumption of the bullish trend.
Key Features include the small candles in the middle, which show a controlled pullback, followed by the final bullish candle that confirms upward momentum. This pattern suggests that buyers remain in control, even when there’s a pause in price action.
What it tells you is that there is a healthy bullish trend with controlled pullbacks. Bears tried to take over but failed to break key support, indicating a strong potential for trend continuation to the upside.
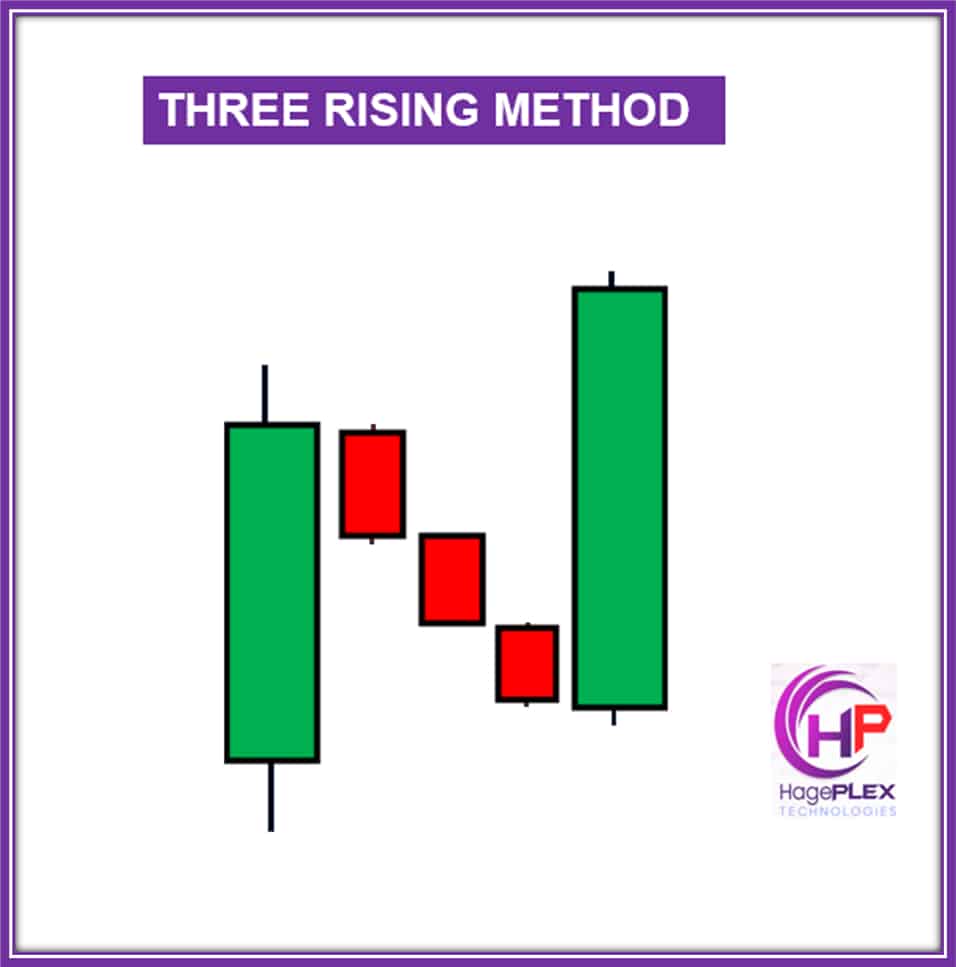
Three Rising Methods – A bullish continuation pattern formed by a long green candle, followed by three small-bodied candles (usually red), and another strong green candle that closes higher than the first. It indicates that the uptrend is likely to continue after a brief consolidation.
32. Shooting Star
Shooting Star is a bearish reversal candle that pops up at the top of an uptrend, like a final push before the fall. It has a tiny body at the bottom and a long upper wick — which means price went up fast, but sellers slammed it back down before the candle closed. It can be red or green, but red packs more punch. What it really says is, “Buyers gave it one last shot, but the sellers won the fight.” When this shows up near resistance or after a strong rally, it’s a warning that the trend might be flipping, and a drop could be coming. Look for a strong red candle after it for confirmation.
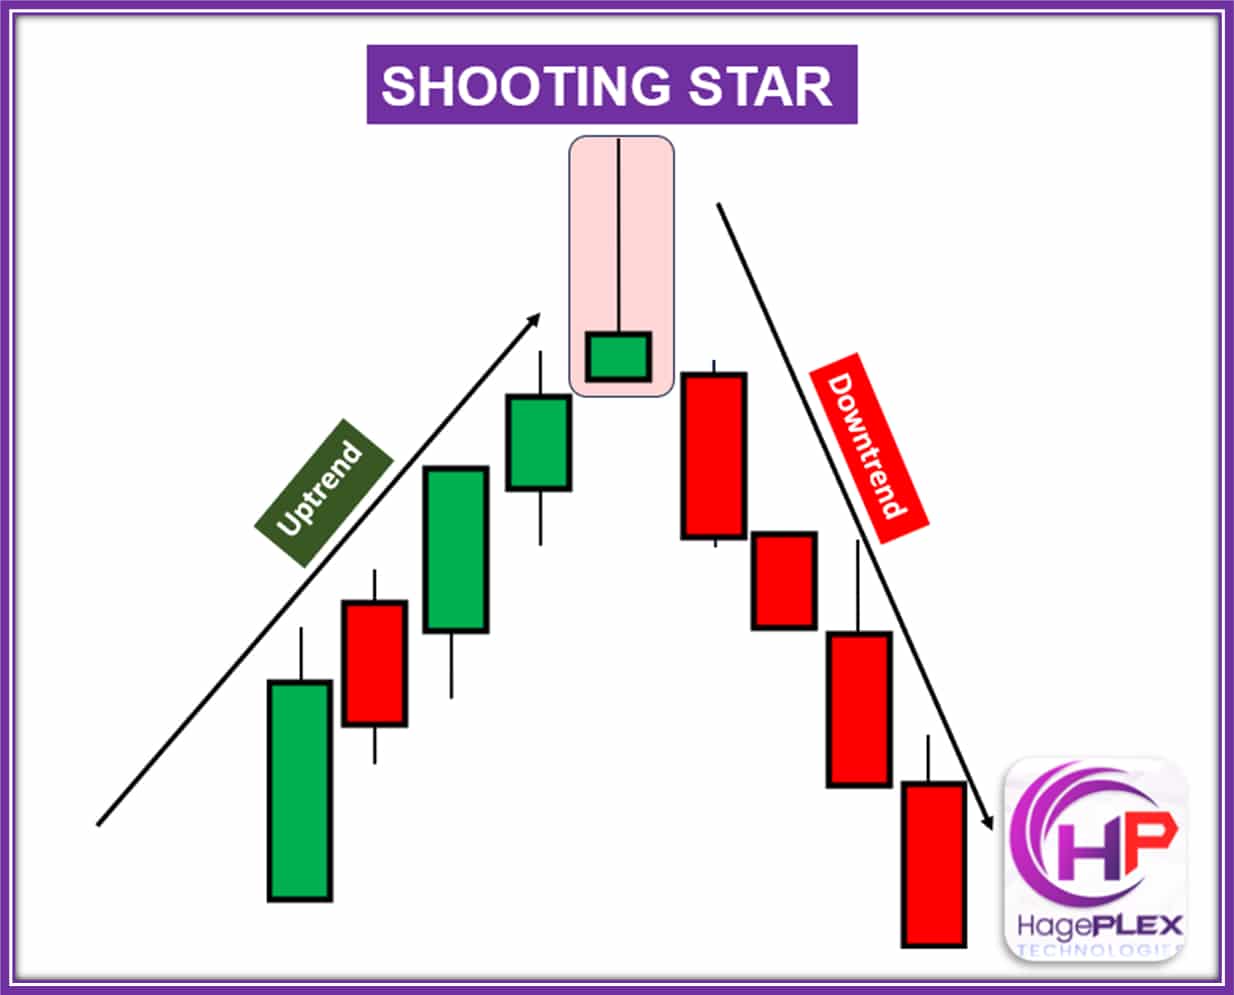
A Shooting Star is a bearish reversal pattern with a small body at the lower end, a long upper wick, and little or no lower wick, signaling a potential trend reversal after an uptrend.
33. Tweezer Tops
Tweezer Tops show up like a warning sign at the peak of an uptrend. You’ll see two candles — one bullish, one bearish — but both hit the same high. It’s like the market tried to break higher twice and got smacked down both times. The first candle shows buyers in control, but the second one flips the script as sellers step in hard. It’s a clear sign that momentum is fading and the bulls are running out of steam. When you spot this near resistance or in overbought territory, it’s the market whispering, “Time to cool off.” Watch for a bearish follow-through to seal the deal.
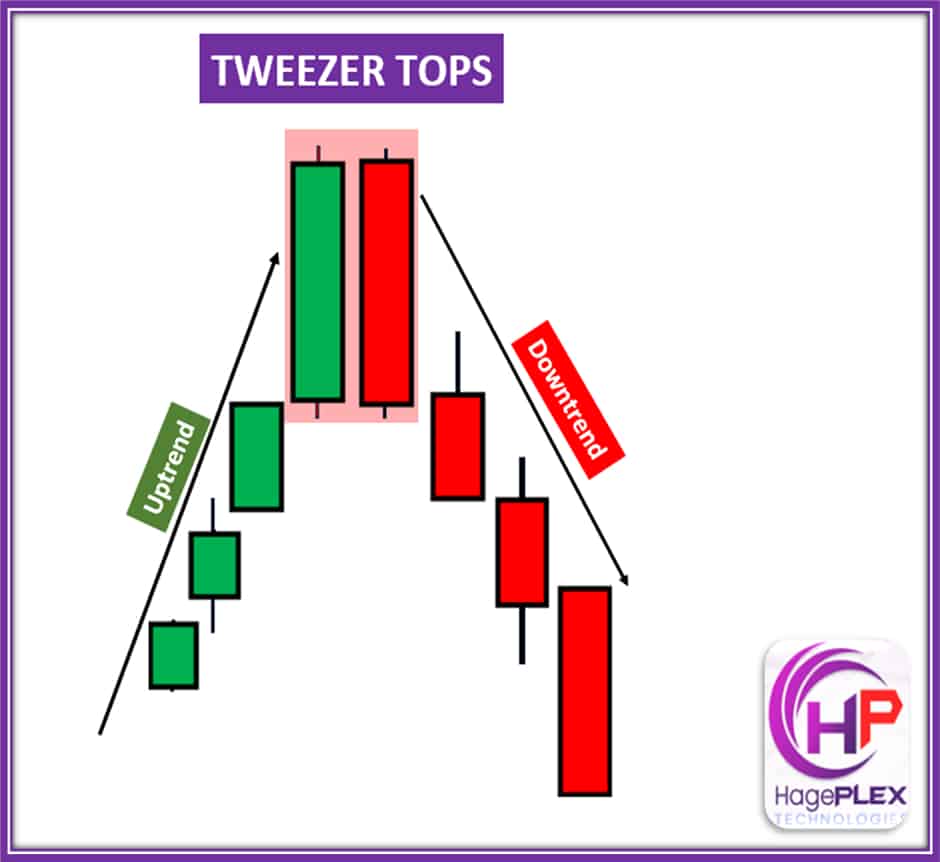
Tweezer Tops are a bearish reversal pattern where two candles with equal highs signal potential trend reversal after an uptrend.
34. Bearish Three Star
Bearish Three Stars in the South is like watching a rally quietly lose its breath. It pops up after a strong uptrend, showing three tiny candles that shrink in size, each one tucking inside the previous. The first might have a long lower shadow, but then things get tighter and weaker. It’s like the bulls are still standing — but barely swinging. Momentum’s fading, and sellers are quietly stepping in. The pattern whispers, “This push upward is done.” If the price breaks below the third candle, that’s usually the cue for a sharper drop. Add volume or a big bearish follow-up, and you’ve got yourself a strong reversal signal.
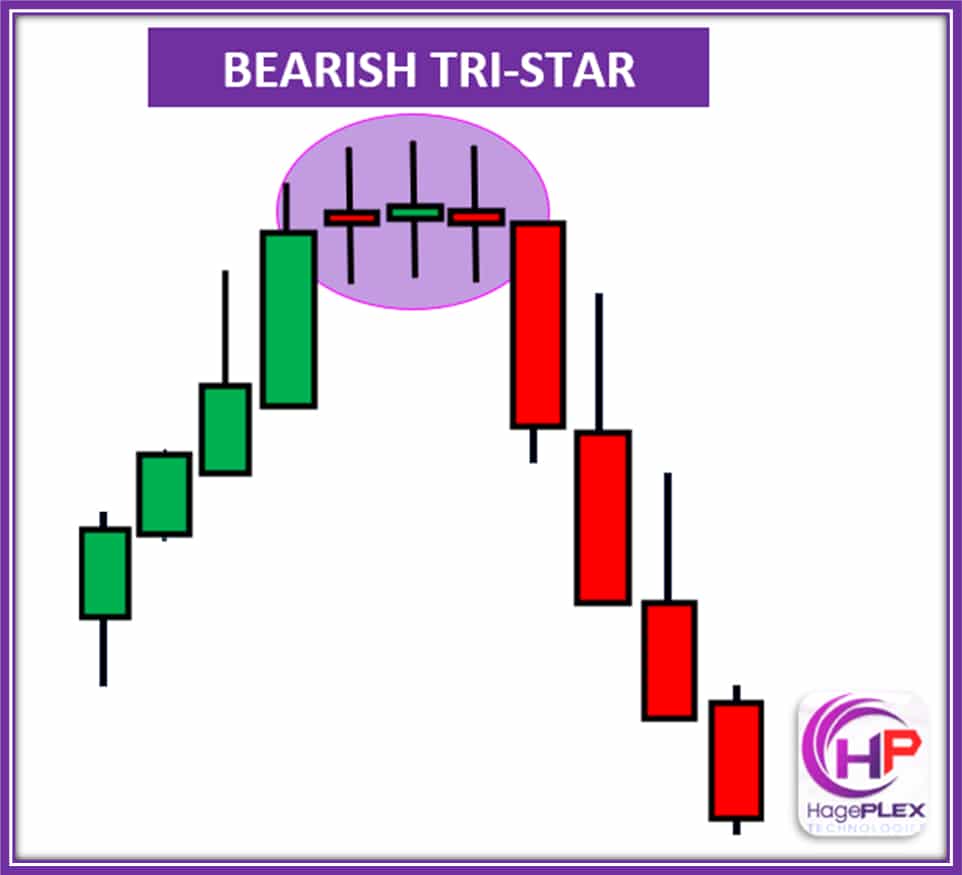
Bearish Three Star is a reversal pattern where three consecutive bearish candles form after an uptrend, indicating a strong shift toward selling pressure.
35. Gravestone Doji
Gravestone Doji shows up like a warning at the top of an uptrend — and it’s not just the name that’s ominous. The candle opens, shoots way up during the session, but then sellers slam it right back down, closing near the open. The result? A long upper wick and a flat base, like an upside-down “T.” It tells you bulls tried hard, but bears completely shut them down. It screams “rejection” of higher prices. But don’t jump in just yet — this pattern needs confirmation, like a solid bearish candle right after, to confirm the market might be ready to drop.
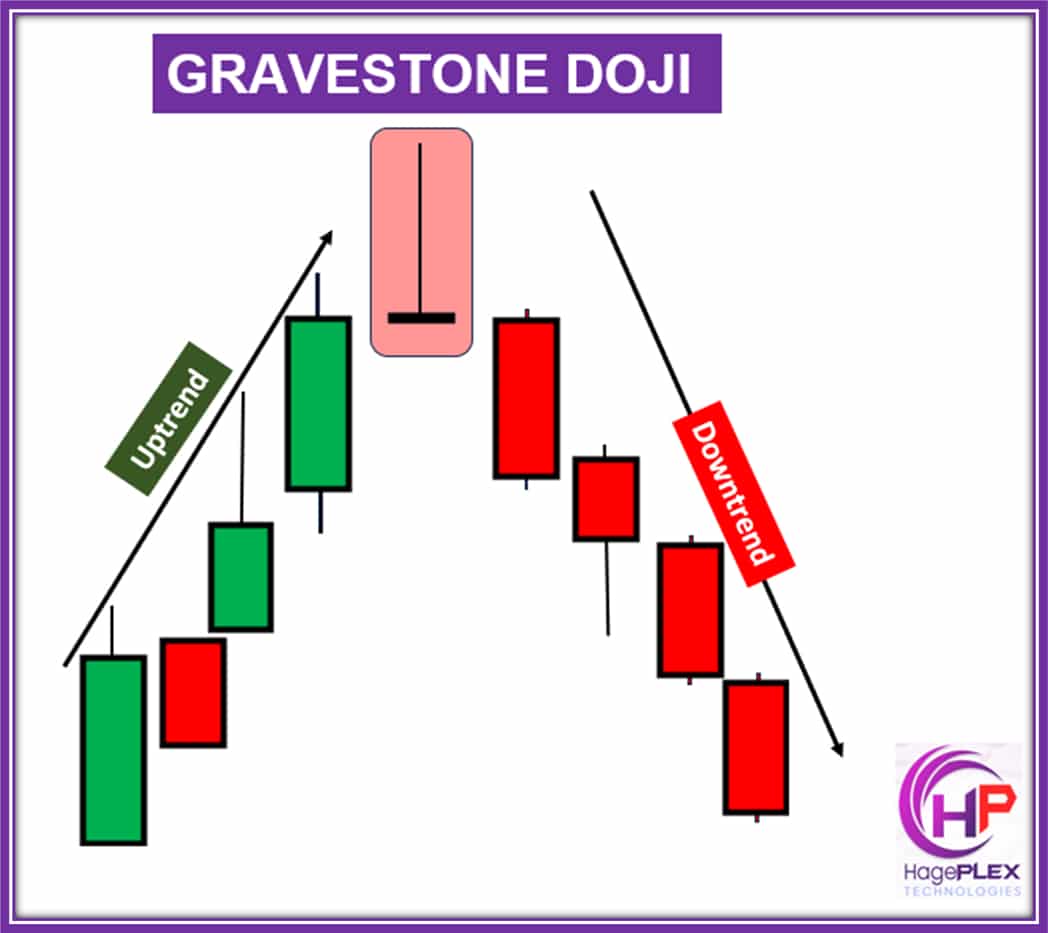
Gravestone Doji is a bearish reversal pattern that forms at the top of an uptrend, signaling potential reversal. It has a long upper shadow, little to no body, and a small lower shadow.
36. Hanging Man
Hanging Man pops up at the top of an uptrend like a quiet warning bell. It has a small body at the top, a long lower wick, and little to no upper wick — like the price dropped hard but got pulled back up by close. Sounds bullish? Not quite. It means sellers did show up during the session, even if buyers saved the day… for now. When you see it after a rally, it’s a hint that bulls are getting tired and bears are creeping in. But don’t act too fast — wait for confirmation with a strong red candle or a gap down to seal the deal.
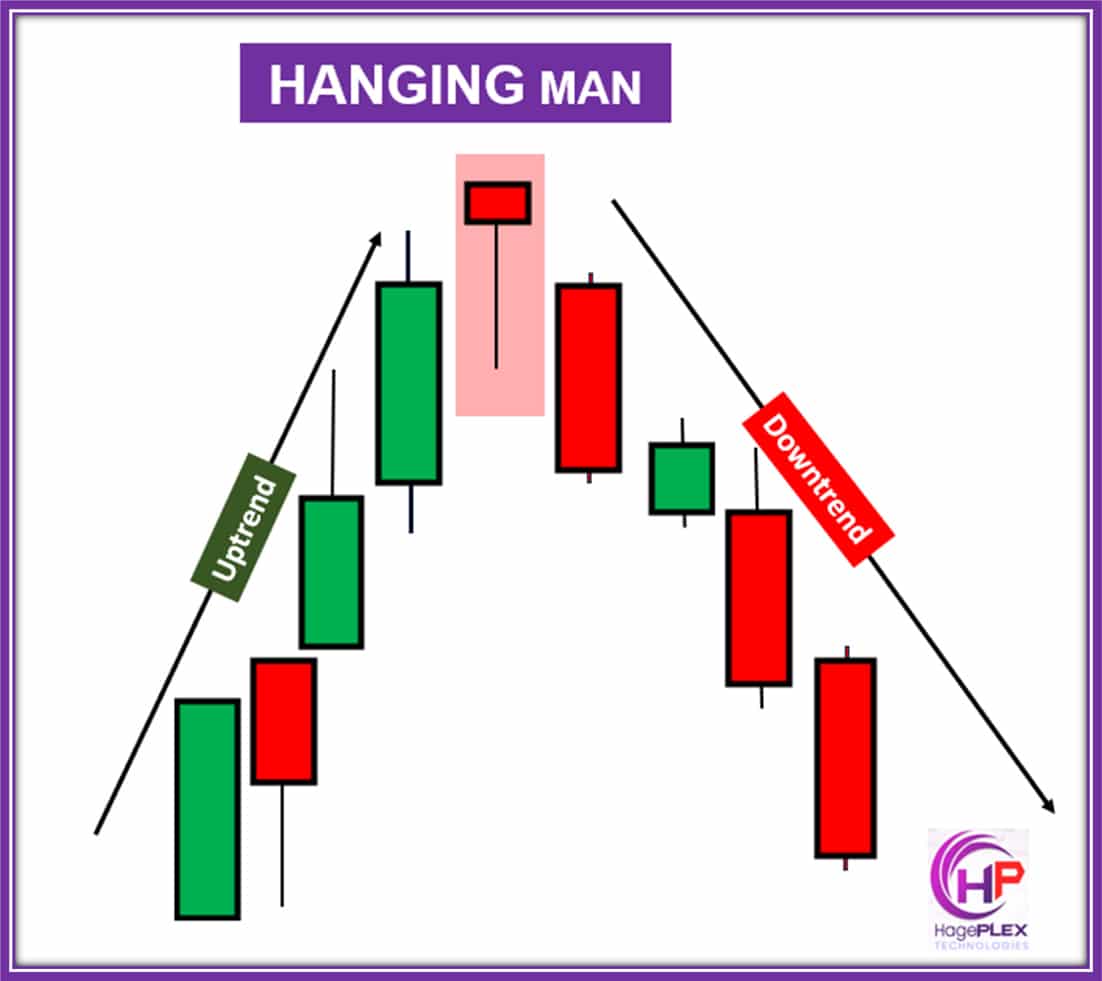
Hanging Man is a bearish reversal pattern that forms at the top of an uptrend. It has a small body at the top with a long lower shadow, indicating potential selling pressure and trend reversal.
37. Bearish Marubozu
Bearish Marubozu is a no-nonsense candle that screams seller strength. It has a long bearish body with little to no wicks — ideally, the open is the high, and the close is the low. That means sellers were in charge from start to finish. You’ll spot it during a downtrend (momentum continuation) or after an uptrend (reversal warning). It tells you bulls didn’t stand a chance — they got overpowered the entire session. When volume confirms it or it forms near resistance, this candle becomes a major red flag for more downside. Want to trade it? Just wait for a close below the candle, set your stop above the high, and aim for the next support.
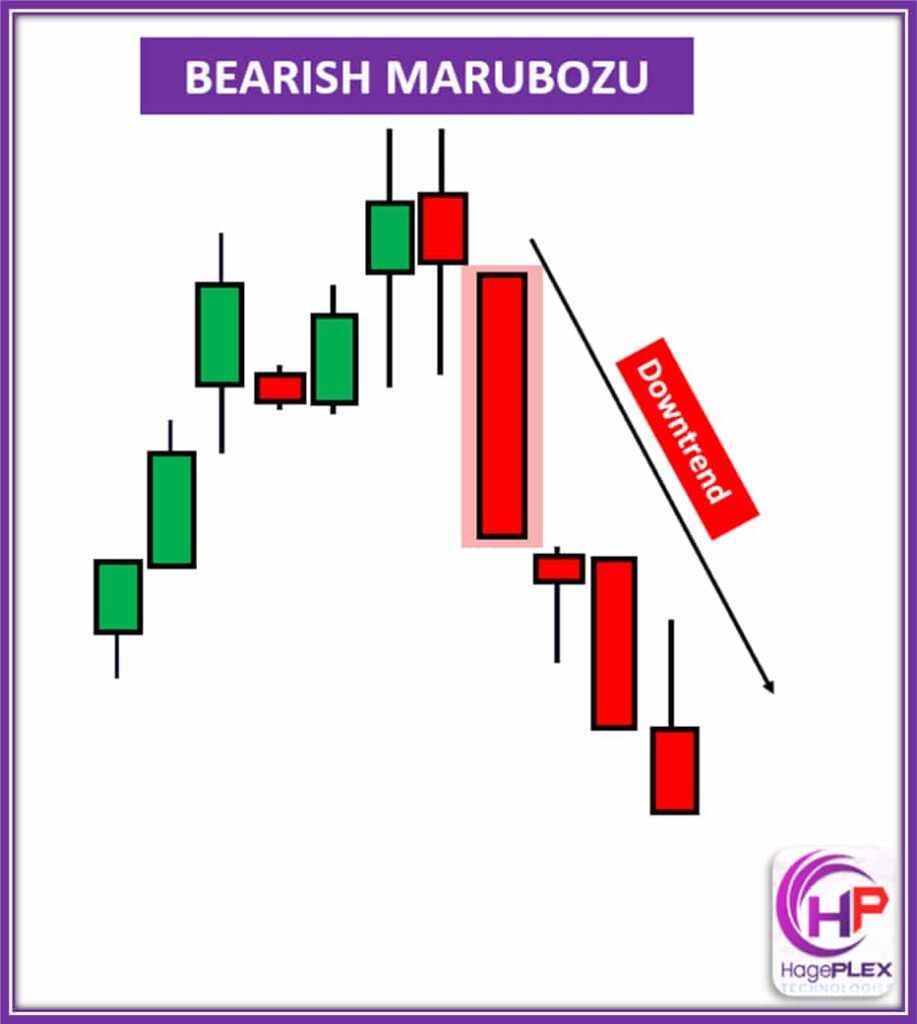
Bearish Marubozu is a strong bearish reversal pattern characterized by a large red candle with no wicks, indicating that sellers controlled the entire session from open to close.
38. Bearish Open Marubozu
Bearish Open Marubozu is a clear sign the sellers kicked off the session in full control — and stayed that way. It opens at the high (no upper wick) and dives lower with a strong bearish body. There might be a small lower wick, showing a tiny bit of buyer pushback near the end, but overall? It’s bearish through and through. You’ll usually see this pattern after a rally (as a reversal) or mid-downtrend (as a momentum booster). It screams profit-taking or panic selling. When paired with high volume or follow-through red candles, it often leads to deeper drops. Want in? Enter below the low, stop above the high, and target the next support.
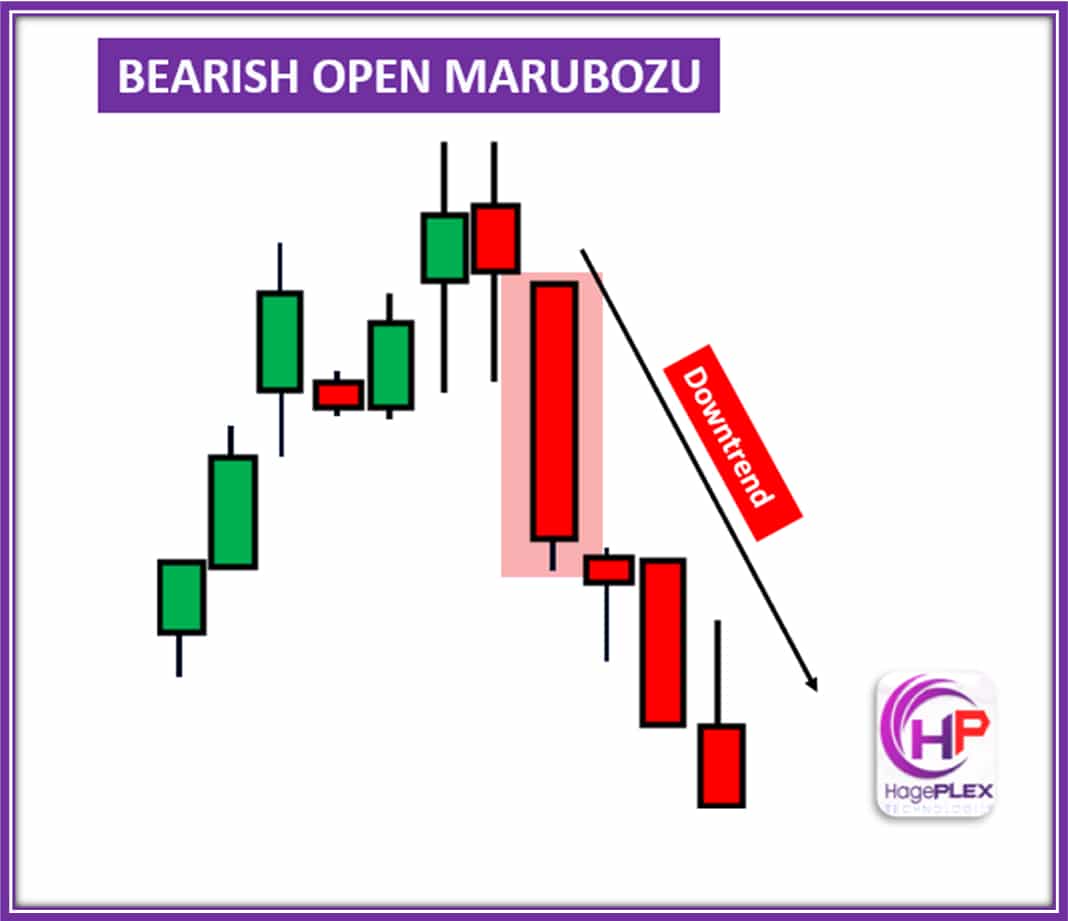
Bearish Open Marubozu indicates strong selling pressure from the start of the session, suggesting potential continuation of the downtrend.
39. Evening Star Doji
Evening Star Doji is a powerful sign that the bulls are running out of steam. It shows up after a strong uptrend and unfolds in three parts: first, a big bullish candle showing strong momentum. Then comes the Doji — a moment of hesitation and balance, where neither buyers nor sellers take control. Finally, a strong bearish candle slams lower, closing into or even below the first candle’s body. This combo signals a clear momentum shift. Buyers are tired, and the bears are back in charge. It’s especially convincing when near resistance or paired with high volume. A classic sign that a reversal is brewing.
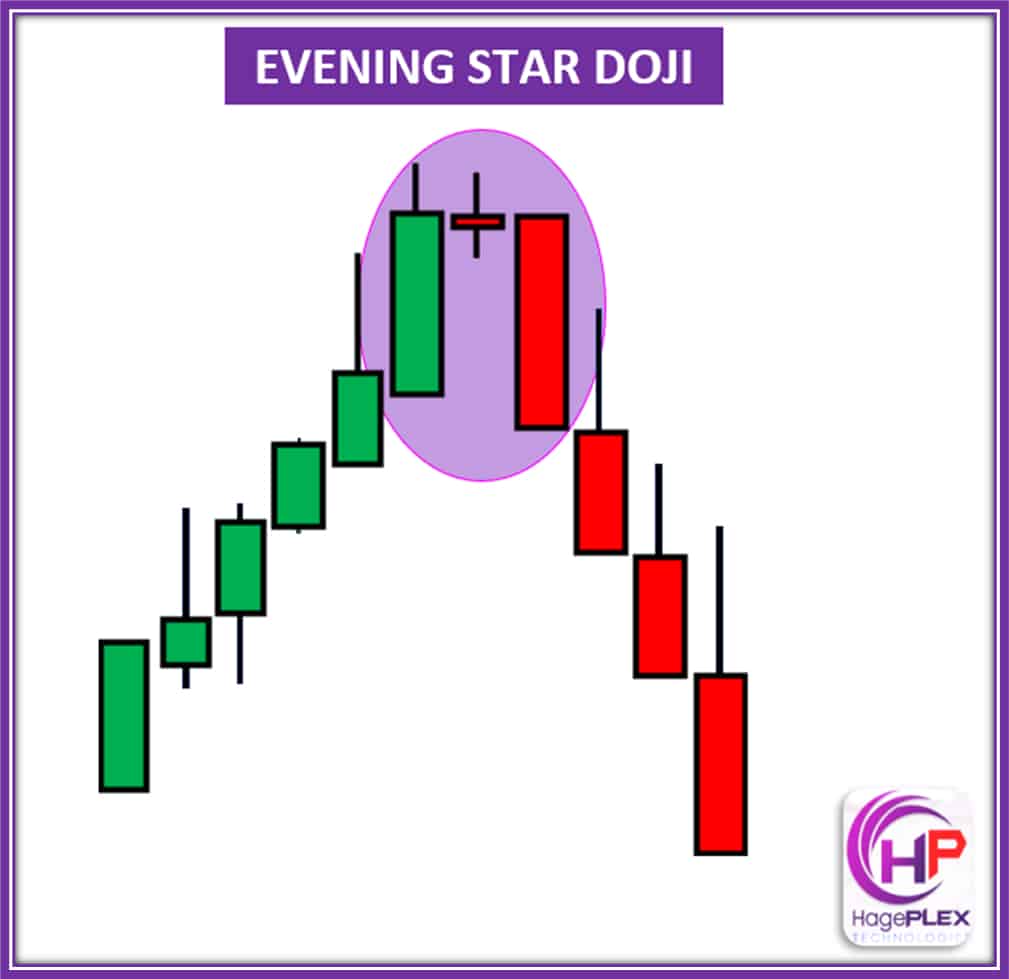
Evening Star Doji is a bearish reversal pattern consisting of three candles: a strong bullish candle, a small-bodied Doji, and a strong bearish candle. It signals a potential trend reversal from up to down.
40. Bearish Engulfing
Bearish Engulfing is a loud warning that the uptrend may be ending. It’s made of two candles — first, a small green candle showing lingering bullish momentum. Then suddenly, a big red candle swallows it whole. This shift shows buyers tried to keep pushing up, but sellers came in with full force and took over. It’s a strong sign that sentiment has flipped. When this pattern appears near resistance or after a big rally, it often means a reversal is on the way.
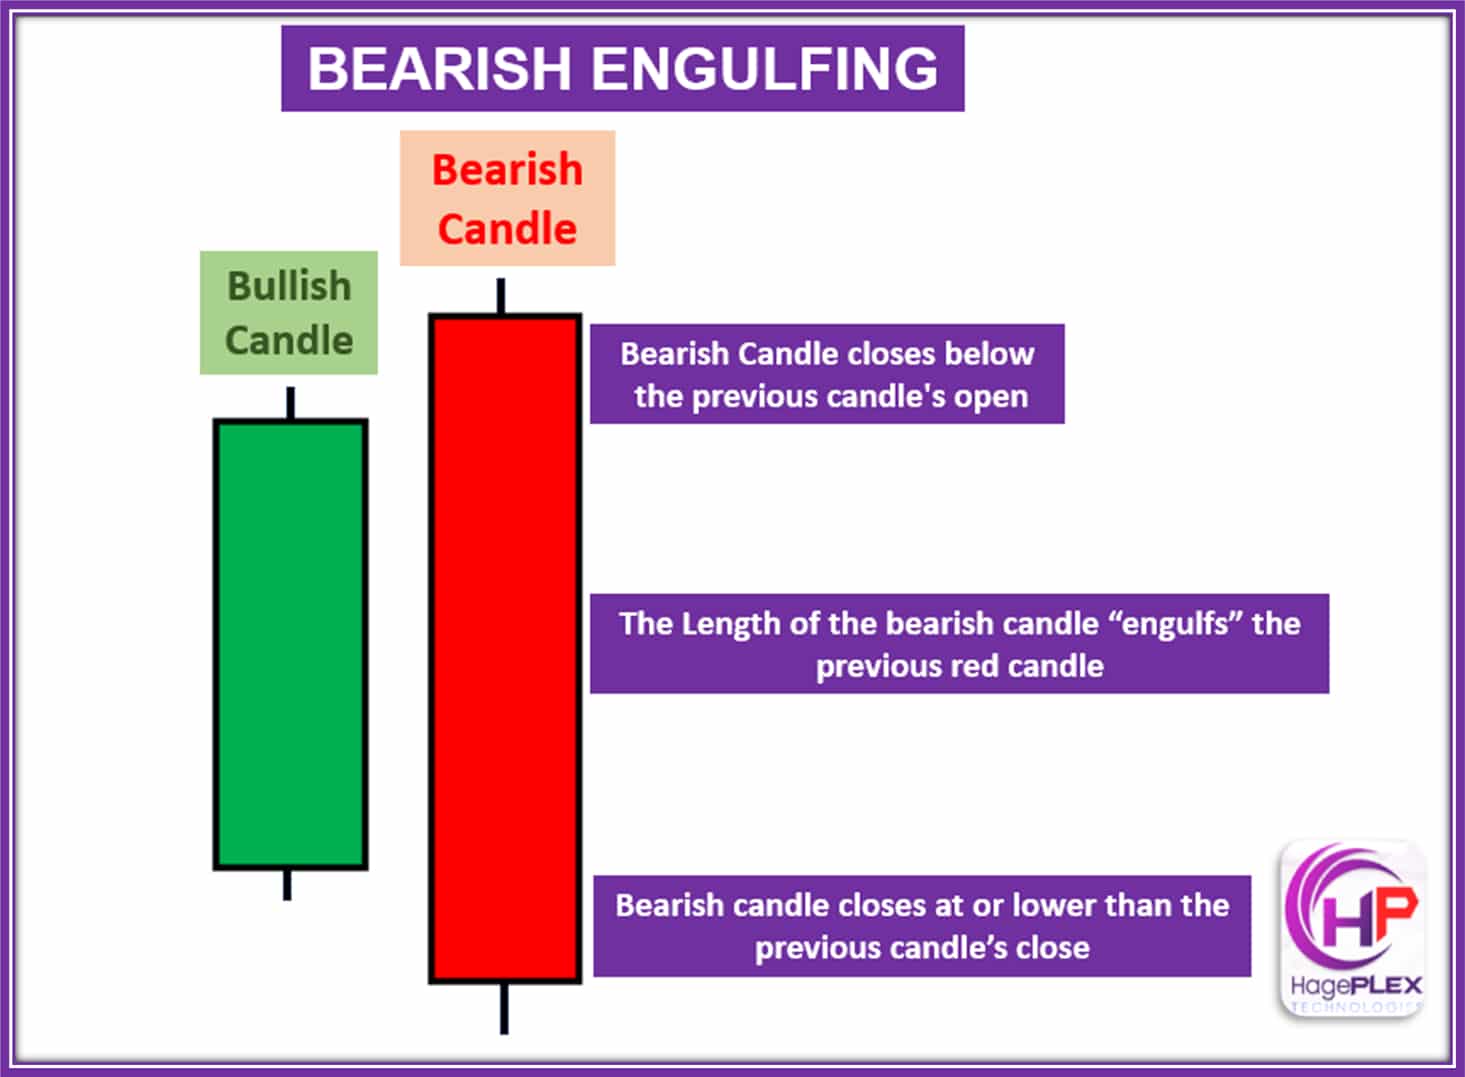
Bearish Engulfing is a two-candle pattern where a large bearish candle completely engulfs the previous bullish candle, signaling a potential trend reversal from up to down.
41. Evening Star
Evening Star is a classic reversal pattern that shows bulls are running out of steam. It starts with a strong green candle pushing higher. Then comes a small candle (maybe a doji or weak-bodied one) that shows indecision — momentum is fading. Finally, a solid red candle crashes back down, closing deep into the first candle’s body. This combo tells us buyers gave it their best shot, but sellers stepped in hard. When this forms at the top of an uptrend or near resistance, it often signals the start of a bearish move.
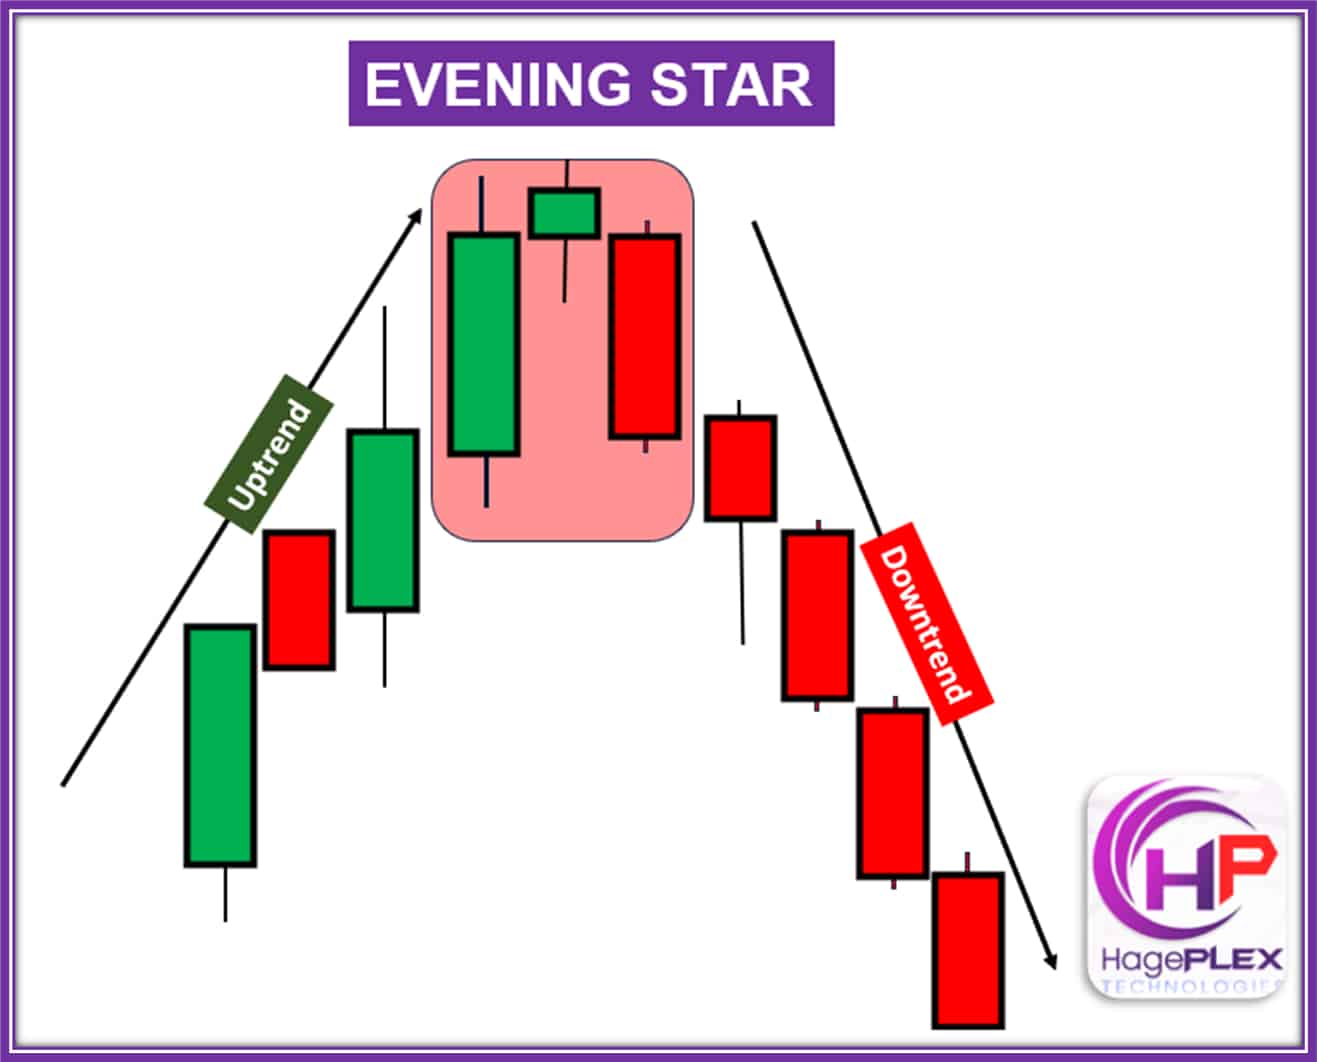
The Evening Star is a three-candle pattern signaling a bearish reversal and a shift from upward momentum to downward.
42. Dark Cloud Cover
Dark Cloud Cover is a sharp warning that the uptrend might be over. It starts with a strong green candle, full of bullish confidence. The next day, price gaps up — but instead of continuing higher, it reverses hard. The red candle not only opens above the previous high but slams down, closing more than halfway into the green candle. This sudden shift tells us sellers just flipped the script, rejecting higher prices and taking control. When this happens near resistance or after a strong rally, it often marks the start of a bearish turn.
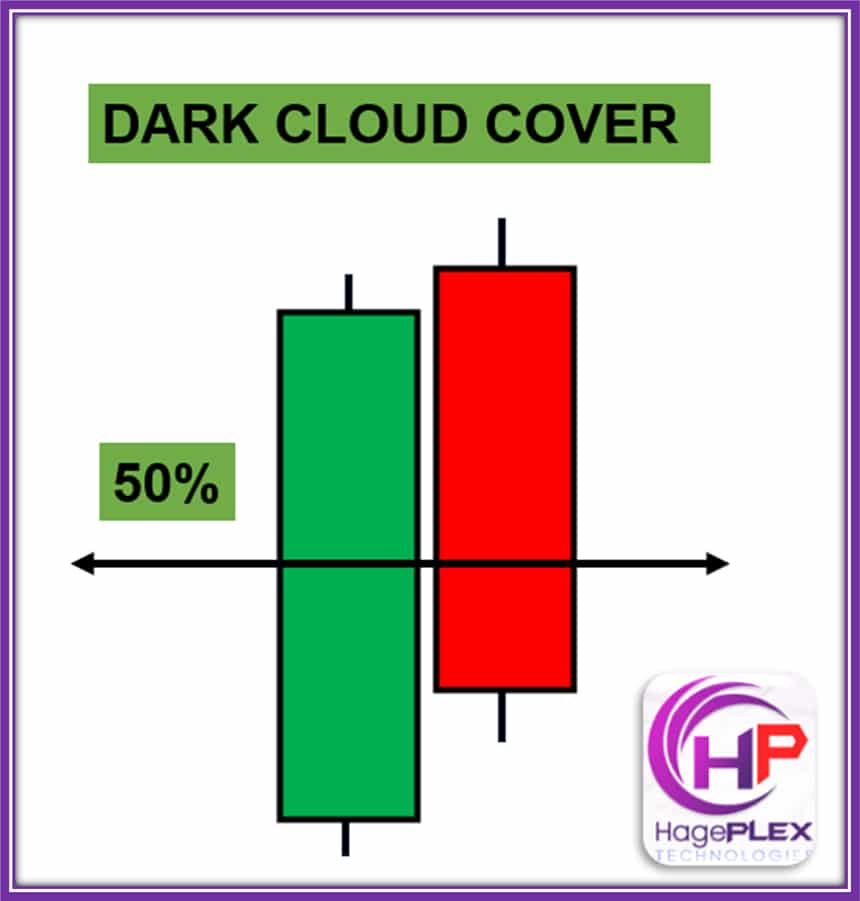
The Dark Cloud Cover is a two-candle bearish reversal pattern that signals a potential shift from upward to downward momentum.
43. Bearish Harami
Bearish Harami is a subtle but powerful warning that the bulls are running out of steam. It starts with a big, bold green candle showing strong buying. Then comes a much smaller red candle that fits entirely inside the first one — like a baby tucked into its parent. This “pause” signals hesitation. Buyers are slowing down, and sellers may be getting ready to step in. It doesn’t always cause an immediate drop, but if the next candle confirms the move with a break lower, it can mark the start of a bearish reversal.

The Bearish Harami is a two-candle bearish reversal pattern which suggests a slowdown in bullish momentum and a potential reversal to the downside.
44. Three Outside Down
Three Outside Down is a loud warning that the bulls just lost control. It kicks off with a small bullish candle — nothing dramatic. Then, a big bearish candle follows and completely swallows the first one, signaling that sellers have taken over. But the clincher? The third candle pushes even lower, confirming the momentum shift. This pattern screams bearish reversal, especially if it shows up near resistance or after a strong uptrend. It’s like watching the market slam on the brakes and throw it into reverse.
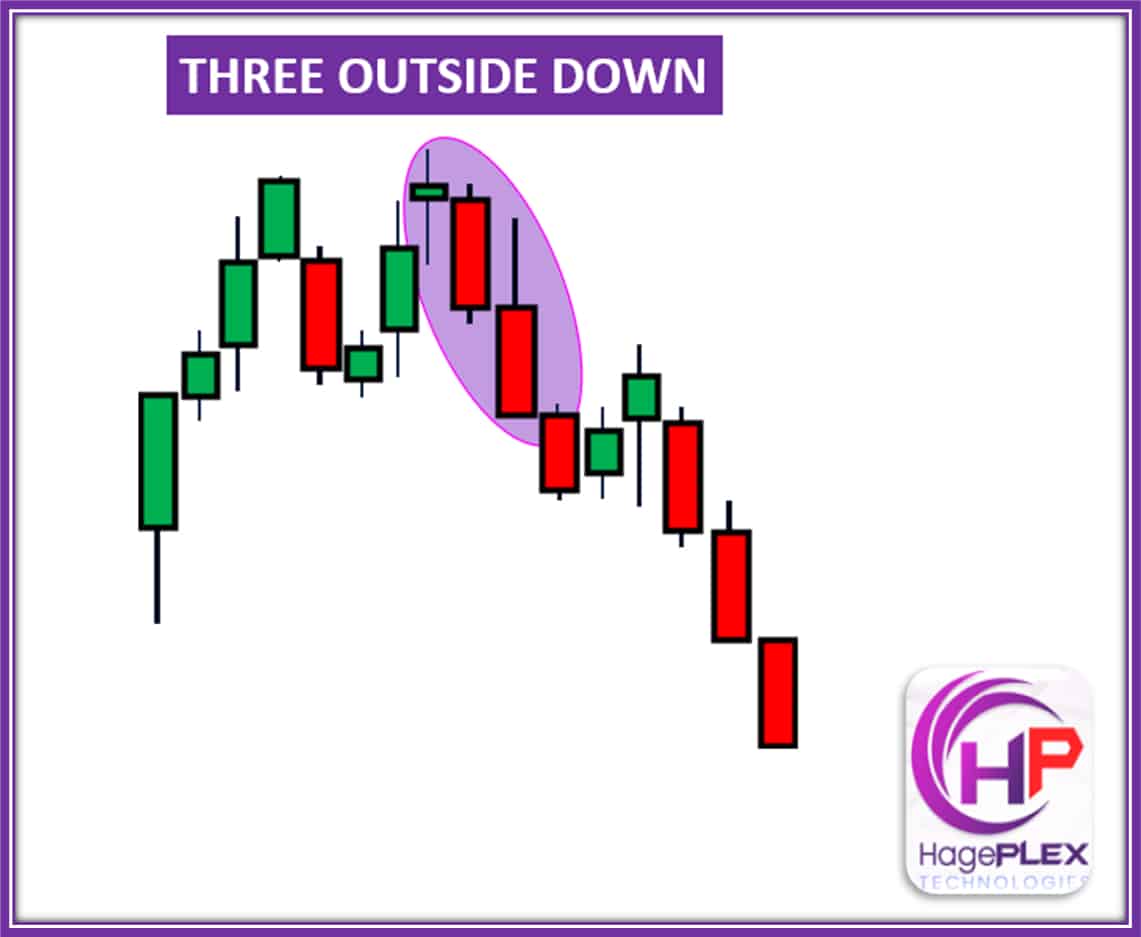
The Three Outside Down is a bearish reversal pattern consisting of three candles: a strong bullish candle, followed by a smaller bearish candle that fully engulfs it, and a final large bearish candle. It indicates a shift in momentum from buying to selling.
45. Bearish Abandoned Baby
Bearish Abandoned Baby is a rare but powerful signal that the bulls are done. It starts with a strong bullish candle, showing confidence. Then comes a lonely doji that gaps up — this is the “abandoned baby,” stuck between trends, showing hesitation. Finally, a big bearish candle gaps down and seals the deal, signaling that sellers have taken full control. No overlap between the candles makes this pattern extra clear. When this shows up near resistance or after a strong rally, it often means a sharp reversal is coming.
The Bearish Abandoned Baby is a rare three-candle pattern that signals a strong bearish reversal.
46. Bearish Counter Attack
Bearish Counter Attack is a sharp reversal pattern that feels like a slap back from the bears. It kicks off with a strong bullish candle—buyers in full control, pushing price to the highs. But right after, the next candle opens at the same level… and drops hard. That second bearish candle closes deep into the previous green one, almost undoing all the gains. It’s like the market said “not so fast” to the bulls. This pattern screams rejection and signals a potential shift downward, especially if it forms near resistance or is backed by high volume. Confirmation helps seal the setup.
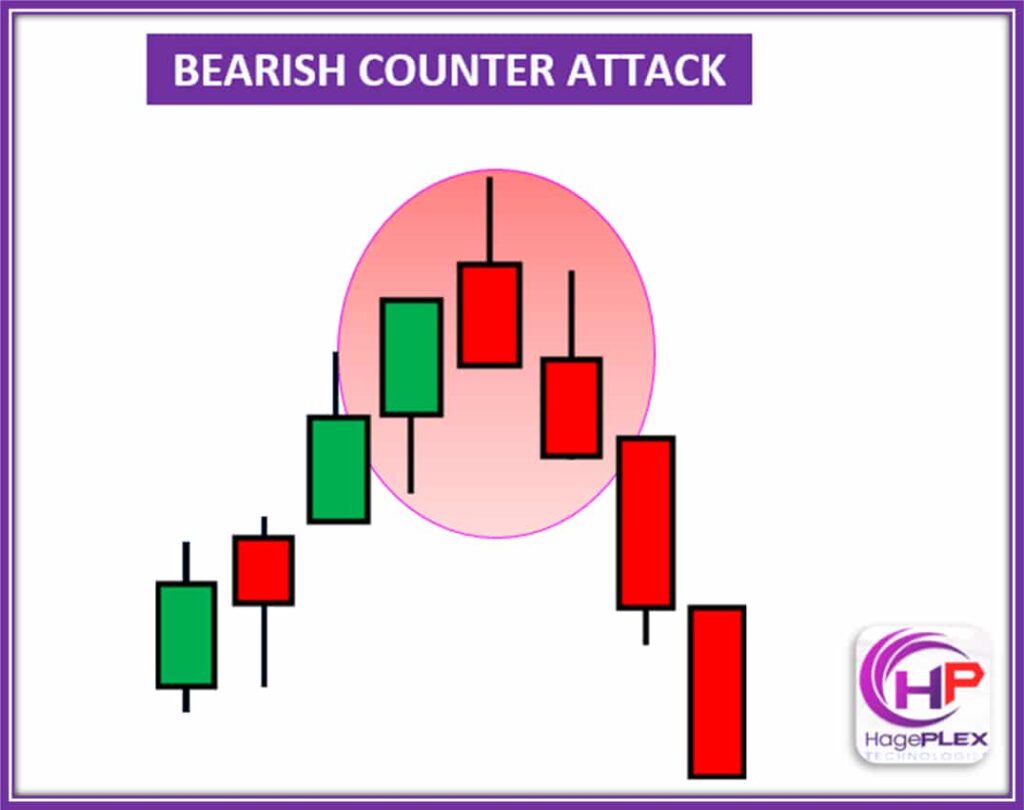
The Bearish Counter Attack is a two-candle pattern where a large bullish candle is followed by a strong bearish candle. This pattern suggests a shift in momentum, with sellers taking control after a previous uptrend.
47. Bearish Stick Sandwich
Bearish Stick Sandwich may look sweet, but it can turn sour for bulls. This pattern has three candles: a green bullish candle, a small red bearish candle, then another green candle that closes near the first one. At first glance, it seems bullish — two green candles surrounding a small red one. But here’s the catch: that final bullish push stalls out. Price doesn’t break higher, and that’s your red flag. In a bearish context, it suggests buyers are losing steam, and sellers might be waiting to pounce. If price breaks down afterward, this “sandwich” becomes a trap — a setup for bearish continuation or reversal.
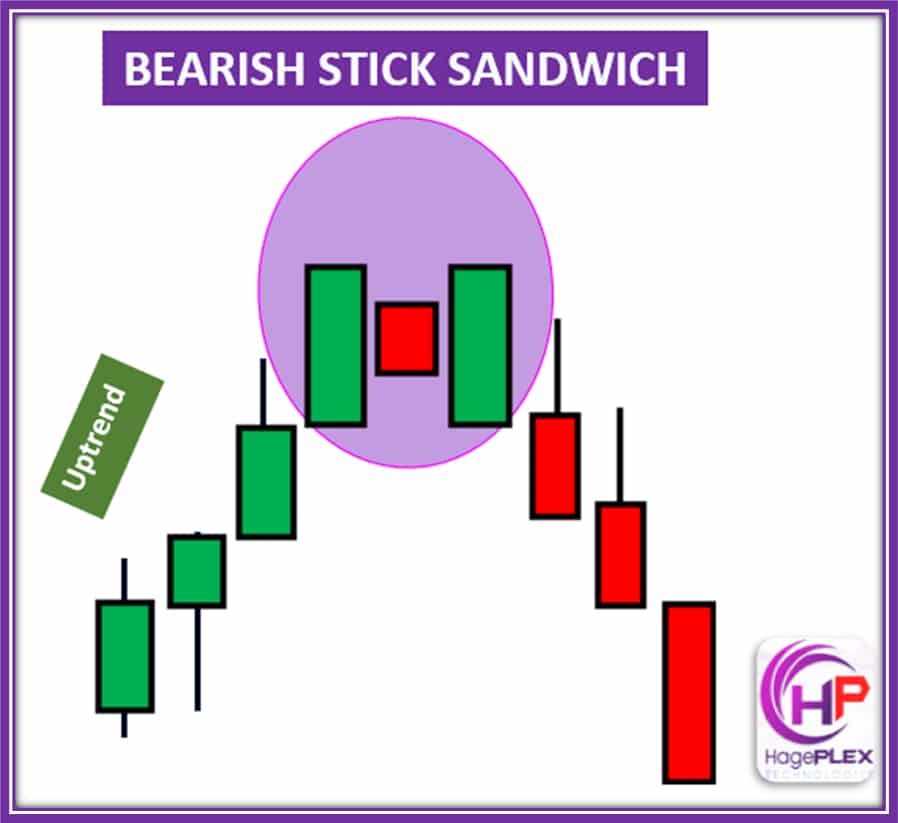
The Bearish Stick Sandwich is a three-candle pattern that indicates a reversal, with the selling pressure overpowering the previous buying momentum.
48. Downside Tasuki Gap
Downside Tasuki Gap is a bearish continuation pattern that shows sellers aren’t done yet. It begins with two strong red candles — the second one gaps down below the first, confirming strong bearish momentum. Then comes a green candle that opens within the body of the second red one and tries to close the gap but doesn’t quite make it. That failed recovery is key. It shows bulls tried to bounce but lacked strength, and sellers are still in control. As long as the gap holds, it signals pressure remains to the downside — often leading to more selling.
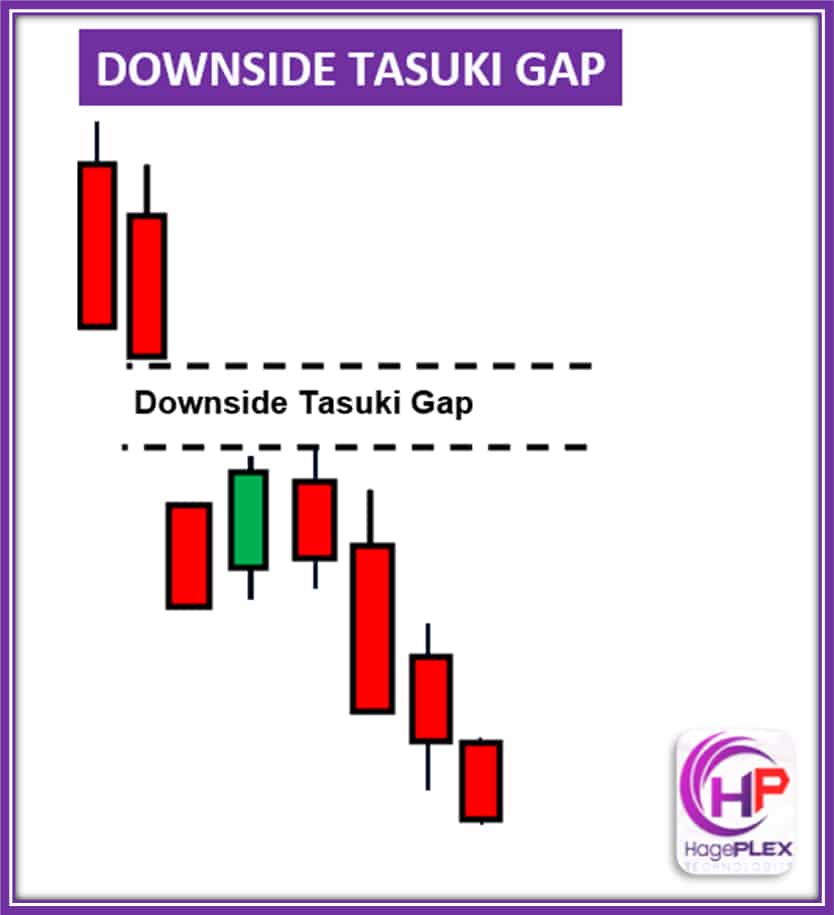
The Downside Tasuki Gap is a bearish continuation pattern where a gap down is followed by a small bullish candle that doesn’t close the gap. It suggests the trend will continue downward.
49. Head and Shoulders
Head and Shoulders is a classic bearish reversal pattern that forms at the top of an uptrend. It consists of three peaks: the left shoulder (price rises and pulls back), the head (a higher peak followed by a pullback), and the right shoulder (price rises but fails to exceed the head’s high). The key to this pattern is the neckline — a line connecting the pullback lows. When price breaks below the neckline, it signals a trend reversal, often leading to a sharp drop. Volume tends to decrease during formation and spikes during the breakdown, confirming the reversal. The measured move target is the distance from the head to the neckline, projected downward.
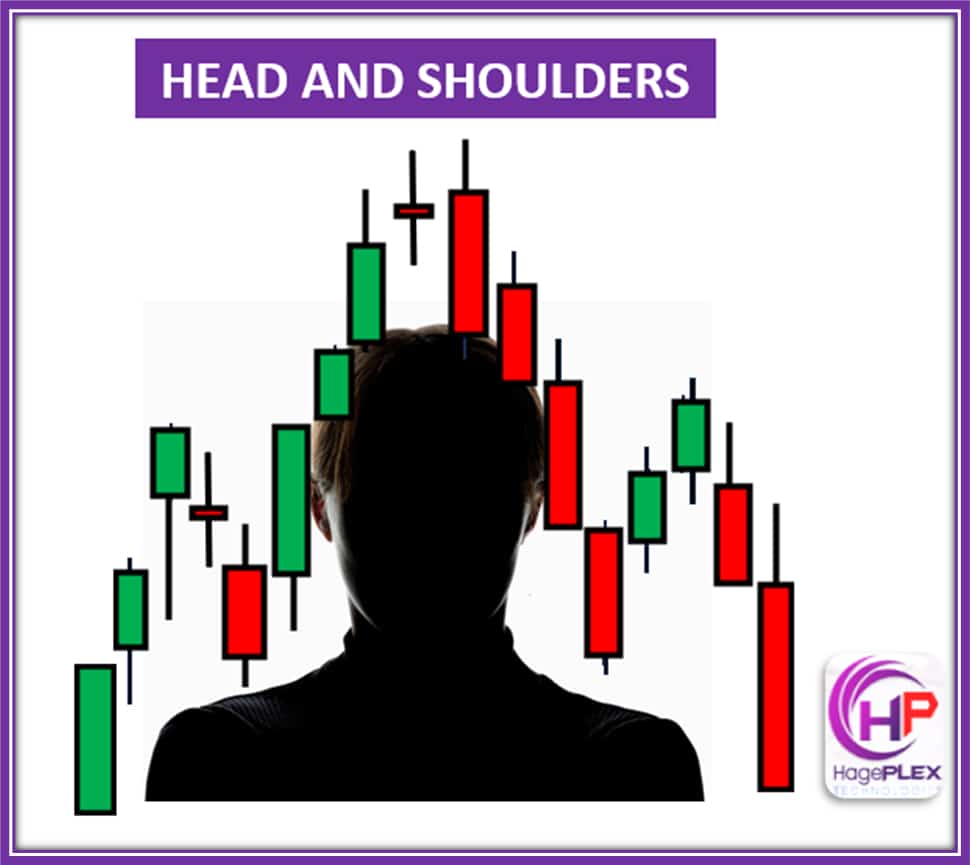
The Head and Shoulders is a bearish reversal pattern, featuring three peaks: a higher peak (head) between two lower peaks (shoulders). It signals a trend reversal when the price breaks below the neckline.
50. Double Top
Double Top is a bearish reversal pattern that forms at the top of an uptrend, often near strong resistance zones or psychological price levels. It consists of two peaks — the first peak is followed by a pullback, and the second peak retests the same high or slightly higher before pulling back again. The neckline is drawn by connecting the lowest points between the peaks. The pattern completes when price breaks below the neckline, confirming a shift from bullish to bearish momentum. The measured move target is the distance from the peak to the neckline, projected downward.
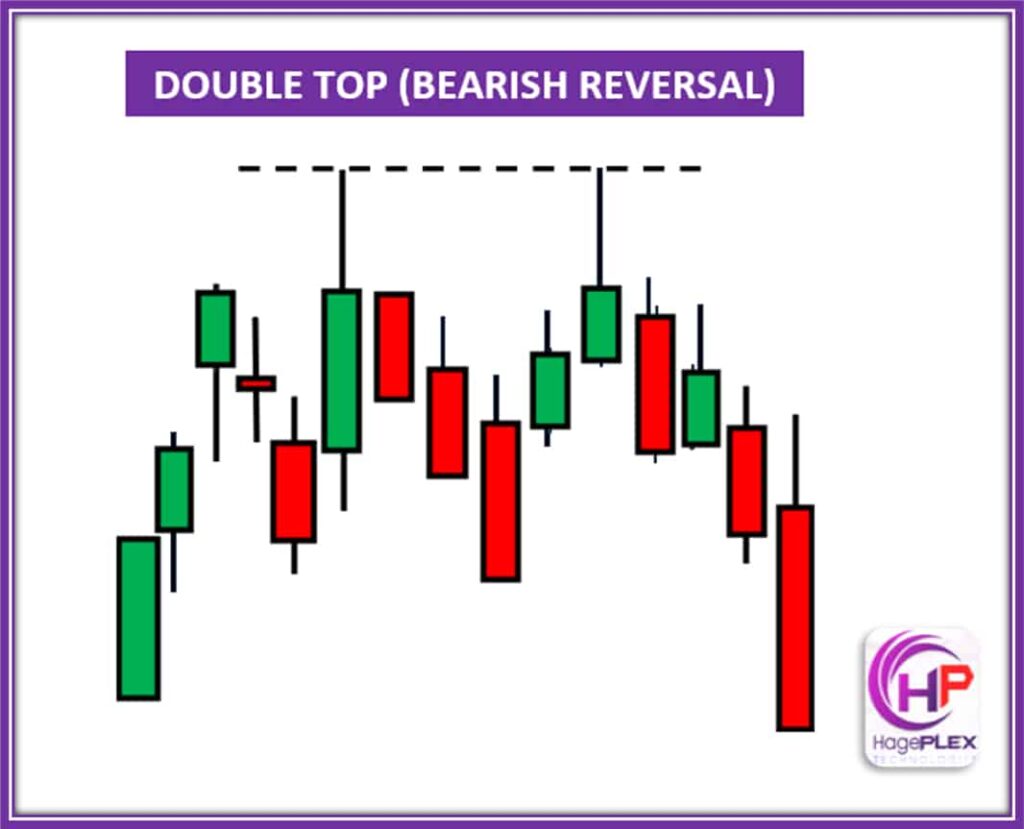
The Double Top is a bearish reversal pattern where the price hits a resistance level twice, forming two peaks, and signals a potential trend reversal after the second peak.
51. Ladder Top
The Ladder Top is a five-candle bearish reversal pattern that usually appears at the end of an uptrend, especially near resistance or after a strong bullish move.
Observing a Ladder Top, you will notice that the first three candles are consecutive bullish (green) candles. This shows strong upward momentum and aggressive buying. The fourth candle is small-bodied (either green or red), signaling indecision and slowing bullish strength. Finally, the fifth candle is a strong bearish (red) candle that closes below the low of the fourth candle. This last candle confirms the shift in sentiment.
The pattern tells us that buyers are starting to lose control. After a period of strong buying, momentum fades, and sellers step in with force. The shift from strong bullish candles to a weak one, followed by a decisive bearish close, shows a transition from buyer enthusiasm to selling pressure.
It’s considered a stronger signal if it forms near key resistance or if there’s a volume spike on the fifth candle. This pattern warns traders that a trend reversal may be underway.
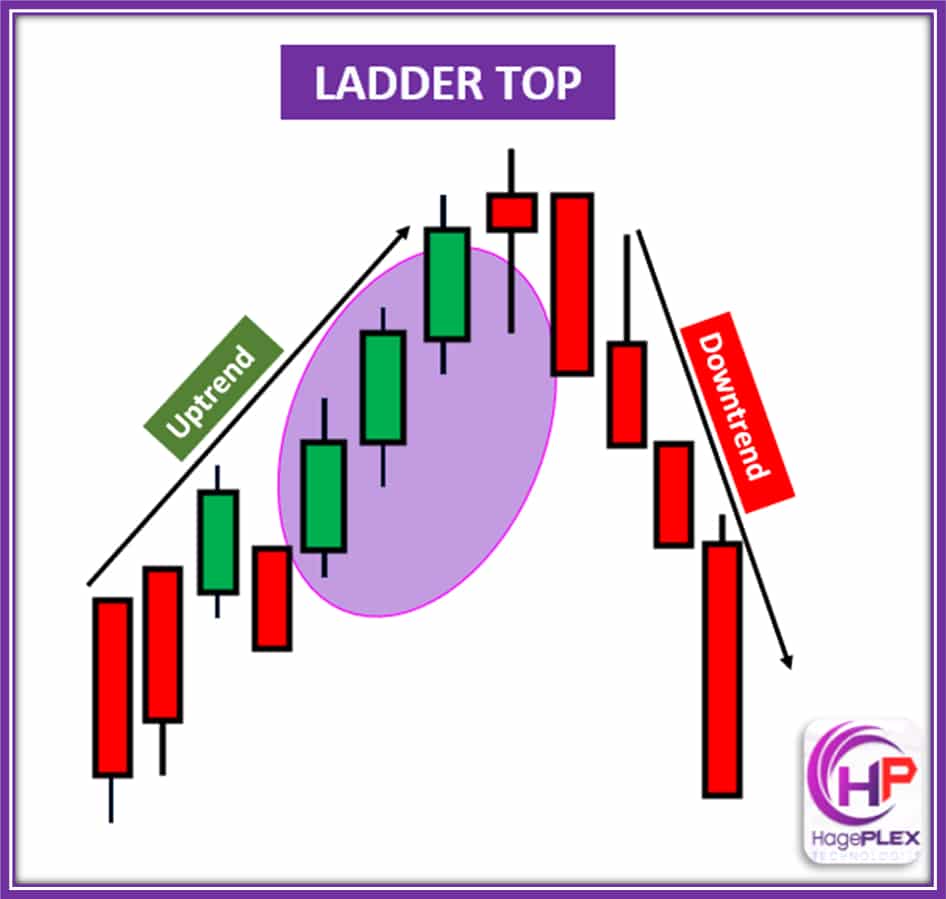
The Ladder Top is a bearish reversal pattern where a series of consecutive bullish candles are followed by a sharp decline, signaling the end of an uptrend.
52. Bearish Kicker
The Bearish Kicker is a powerful two-candle reversal pattern that signals a sudden and aggressive shift from bullish to bearish sentiment. It typically forms after an uptrend or a sharp bullish move, often near resistance levels or in overbought conditions.
The first candle is a strong bullish (green) candle that reflects confident buying. The second candle is a strong bearish (red) candle that opens at or below the first candle’s open, creating a clear gap down. This second candle shows no overlap with the first and usually closes significantly lower, indicating intense selling pressure.
A distinct feature of this pattern is the sharp gap and the lack of wicks, which highlights the force and intent behind the reversal. The second candle essentially “kicks” against the direction of the first, making it one of the most decisive bearish signals in candlestick analysis.
This pattern often results from negative news or a major shift in sentiment. Because of its strength and clarity, it typically doesn’t require additional confirmation.
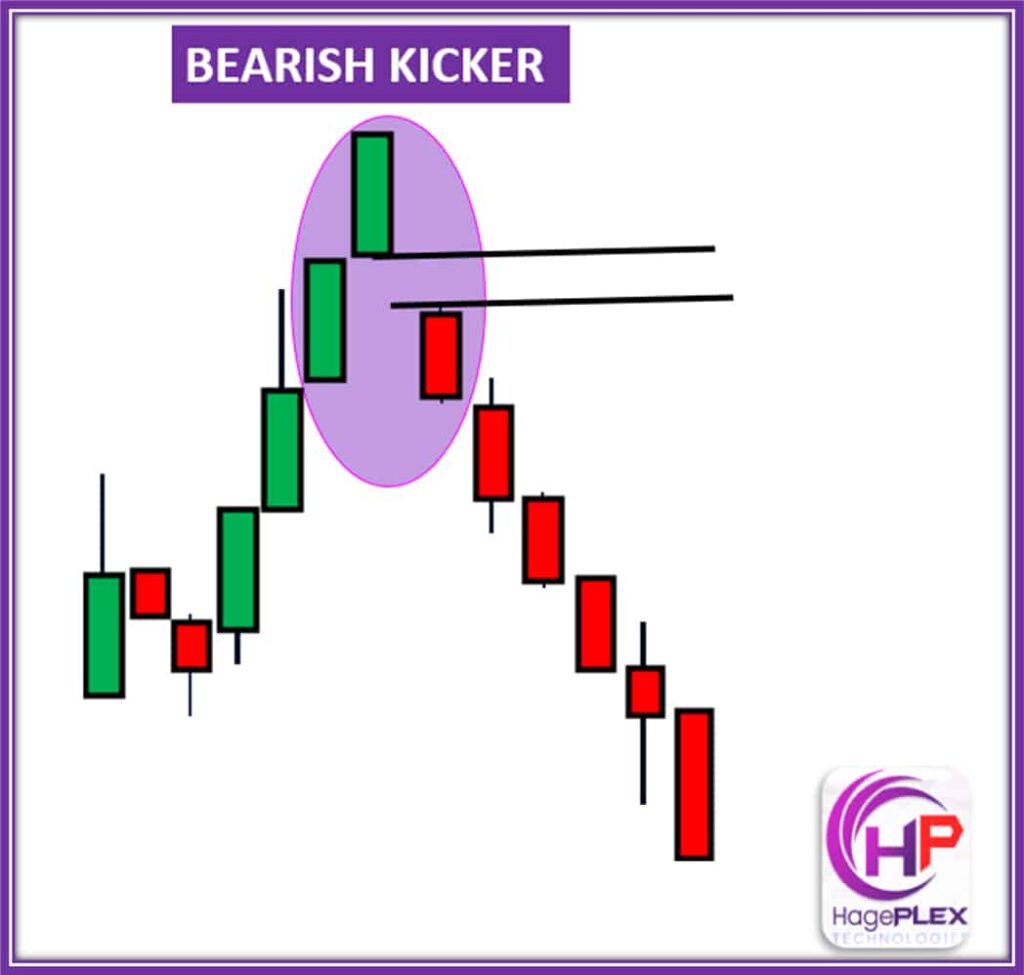
The Bearish Kicker is a strong bearish reversal pattern where a large bearish candle opens at or below the previous candle’s close, creating a gap and signaling a sharp shift from bullish to bearish sentiment.
53. Falling Three Methods
The Falling Three Methods is a bearish continuation pattern that typically appears during an active downtrend. It often forms after a strong bearish move, particularly near resistance levels or after price retests a broken support-turned-resistance.
This pattern consists of five candles. It begins with a large bearish candle, followed by two to three smaller bullish or neutral candles. These middle candles remain within the range of the first candle and reflect a temporary pause or consolidation. The pattern concludes with a strong bearish candle that closes below the low of the first candle.
The smaller candles indicate a brief pullback or hesitation, but not a reversal. Their inability to break above the initial bearish candle suggests that sellers are still in control and absorbing any bullish pressure.
A decisive close from the fifth candle confirms the continuation of the downtrend. This pattern signals that buyers tried to counter the move but lacked the strength, giving bears the opportunity to push prices lower once again. It’s considered a strong signal for trend continuation when aligned with volume or structural resistance.
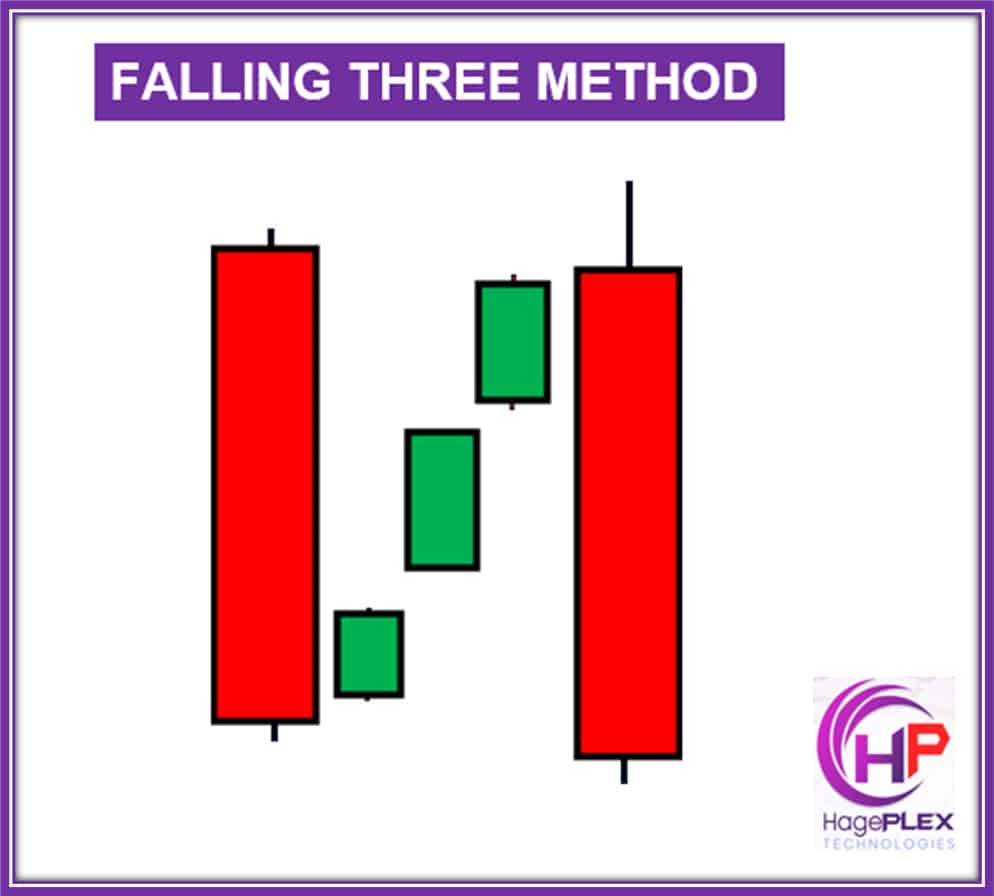
The Falling Three Methods is a bearish continuation pattern consisting of a long bearish candle, followed by three small bullish candles, and ending with another strong bearish candle, signaling the continuation of a downtrend.
54. Bearish Close Marubozu
The Bearish Close Marubozu is a powerful candlestick pattern that signals strong bearish sentiment. It typically forms either as a continuation during a downtrend or as a reversal after an uptrend or sharp rally. You’ll often see it develop near resistance zones or following a breakdown from key levels.
Structurally, this pattern features a long bearish body that closes at the session’s low, with no lower wick. While a small upper wick may appear, it only reflects early bullish attempts that were eventually overpowered by aggressive selling. The price opens higher but is driven down steadily throughout the session, closing at its lowest point.
This price action shows complete control by sellers. Any bullish effort at the beginning of the candle is overwhelmed, leaving little to no recovery into the close. As a result, the pattern represents decisive bearish momentum and often leads to further downside.
For confirmation, traders may consider entering a position below the candle’s low, with a stop loss above its high. Targets are often set at the next support zone, with risk-reward ratios of 1:2 or better. The signal strengthens when paired with high trading volume, a follow-up bearish candle, or indicators like MACD or RSI showing bearish divergence or momentum.
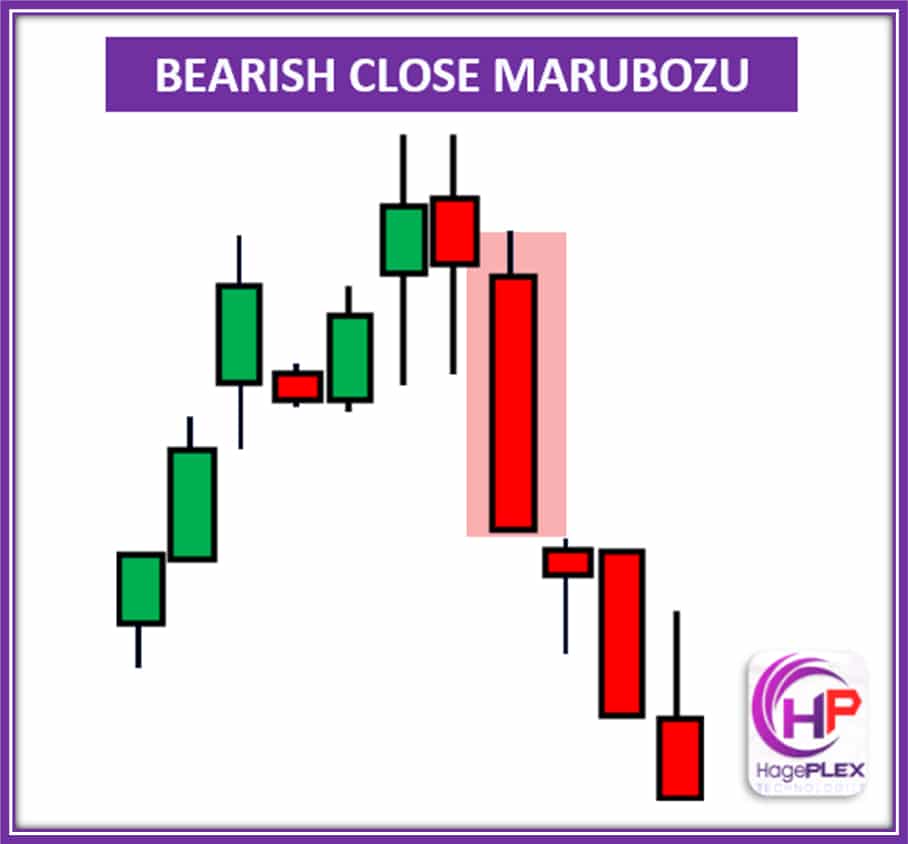
A Bearish Close Marubozu is a candlestick with no upper wick, opening at the high and closing at the low, indicating strong selling pressure and a continuation of the downtrend.
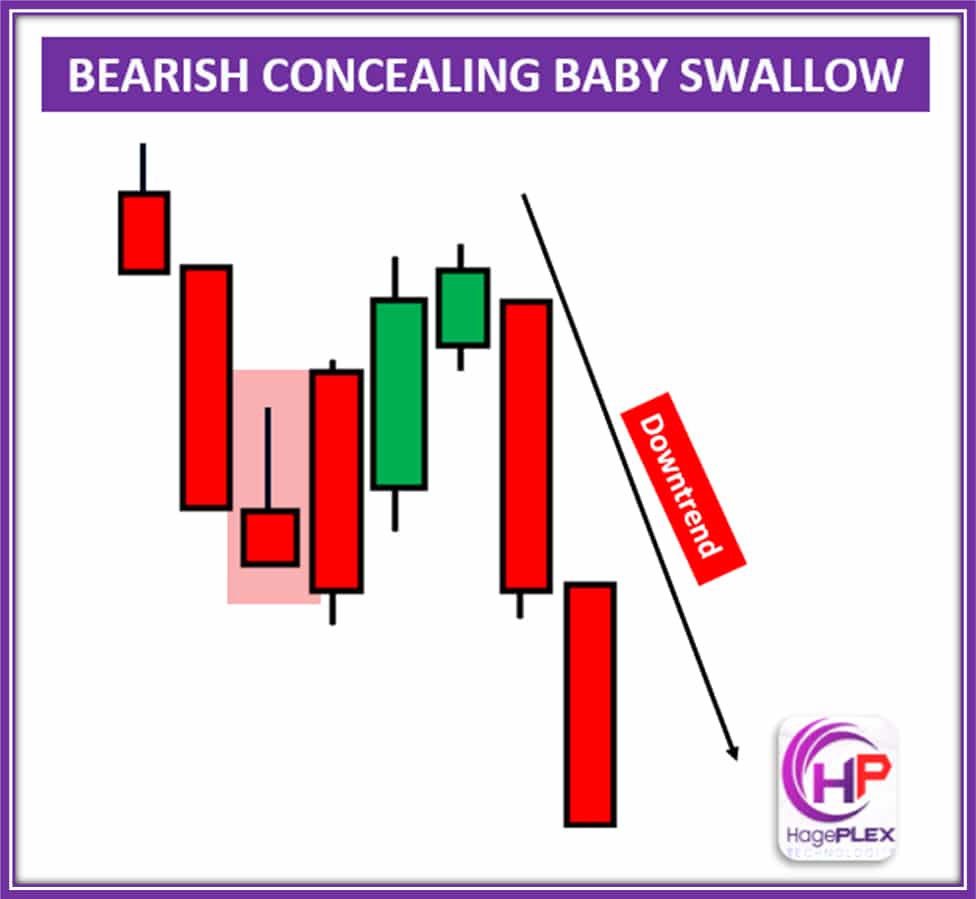
55. Bearish Concealing Baby Swallow
The Bearish Concealing Baby Swallow is a rare but powerful candlestick pattern that signals strong bearish reversal. It usually forms at the end of an uptrend or during a weak retracement within a broader downtrend. You’ll often spot it near major resistance levels or after a steep, overbought rally.
This pattern consists of four candles. The first two are large bearish candles, both with little to no upper wicks, showing aggressive selling pressure. The third candle is a small-bodied one—either bullish or bearish—that becomes completely engulfed by the second candle’s body and shadows. Then comes the fourth candle, a strong bearish one that opens within the range of the third candle and closes well below the bodies of both the second and third candles, effectively “swallowing” the small one.
Such a structure reflects failed bullish recovery attempts. Any effort by buyers to regain control is quickly erased, and sellers step back in with renewed strength. The fourth candle is the final confirmation—it crushes the small “baby” candle, reinforcing the idea that bears are back in full control.
Traders typically look for an entry just below the low of the fourth candle, with a stop loss above the high of Candle 2 or Candle 4. Targets are often placed at the next major support level or based on a favorable risk-reward ratio, such as 1:2 or better. For added confidence, confirmation might come from increased bearish volume, RSI divergence, or a follow-through candle that also closes lower.
Bearish Advanced Block is a pattern where three consecutive bearish candles form, each closing lower than the previous one, signaling strong selling pressure and potential trend continuation downward.
56. Bearish Advanced Block
The Bullish Advanced Block pattern suggests a cautious continuation of an uptrend. It typically appears after a brief pullback or consolidation, often just before price reaches a resistance level or breakout zone. While it reflects ongoing buyer interest, the pattern also hints at hesitation or slowing momentum.
This pattern includes three bullish candles. The first is a strong bullish candle, showing solid upward momentum. The second remains bullish but is slightly smaller and may include an upper wick, which can signal early signs of hesitation. The third candle is even smaller—possibly a near-doji—with a longer upper shadow. This shows that although buyers remain in control, they’re starting to face resistance at higher prices.
Each candle in the sequence reflects declining bullish strength. The shrinking bodies and growing upper wicks suggest rejection from higher levels, and volume may decrease as the pattern forms. While it leans bullish, the setup can precede a temporary stall or minor pullback before the uptrend resumes.
Traders typically confirm the pattern with a strong bullish breakout above the high of Candle 3. Entry is taken on that breakout, with a stop loss below the low of the pattern or beneath Candle 1. The target is usually the next resistance level or a measured move higher with at least a 1:2 risk-reward ratio. Additional confirmation may come from rising volume, RSI above 50, or a follow-up bullish candle that closes firmly higher.
57. Bearish Side-by-Side White Lines
The Bearish Side-by-Side White Lines is a continuation pattern that typically appears during a downtrend. It suggests a brief pause or weak attempt by buyers before sellers resume control. This pattern often forms after a strong bearish candle or a breakdown below support, particularly near resistance zones or after failed bullish recoveries.
The structure begins with a large bearish candle, showing clear selling pressure. It is followed by two small bullish candles. The second candle opens lower than the first but closes higher, showing a slight bullish push. The third candle opens near the second and closes at a similar level, creating a “side-by-side” visual appearance. Despite their bullish nature, these two candles appear hesitant and weak.
This setup signals that buyers are trying to step in but lack real momentum or follow-through. The side-by-side candles often act as a trap for bullish traders, just before the trend continues downward. Sellers typically regain control after this brief pause.
A common strategy is to enter the trade below the low of the third candle or after a confirming bearish candle closes. Stop loss is usually placed above the high of the bullish cluster. The target may be the next support zone, previous swing low, or a measured move based on the prevailing trend.
Bearish Side-by-Side White Lines is a two-candle pattern where two consecutive bullish candles appear side by side, signaling a potential reversal. The pattern suggests that buying pressure may be weakening, and a bearish trend could be starting.
58. Bearish Separating Line
The Bearish Separating Line is a continuation pattern that confirms strong selling pressure during a downtrend. It typically forms after a temporary bullish interruption, often near resistance or during a brief pause in bearish momentum.
This two-candle pattern starts with a bullish candle, which suggests a possible pullback or hesitation in the prevailing downtrend. The second candle opens at the exact same price as the first but closes significantly lower, forming the “separating line.” This identical open emphasizes that the bulls couldn’t hold ground, and the bears quickly regained control.
The pattern signals a sharp rejection of the bullish attempt. Sellers step in at the same level the prior candle began, overwhelming buyers and driving price lower. This creates a strong visual cue that the downtrend is likely to continue.
To trade this pattern, confirmation often comes from a close below the second candle’s low. A stop loss is generally placed above the first candle’s high, with profit targets set at nearby support zones or based on risk-reward projections. Additional confirmation, such as high bearish volume, RSI below 50, or a MACD crossover, strengthens the setup.
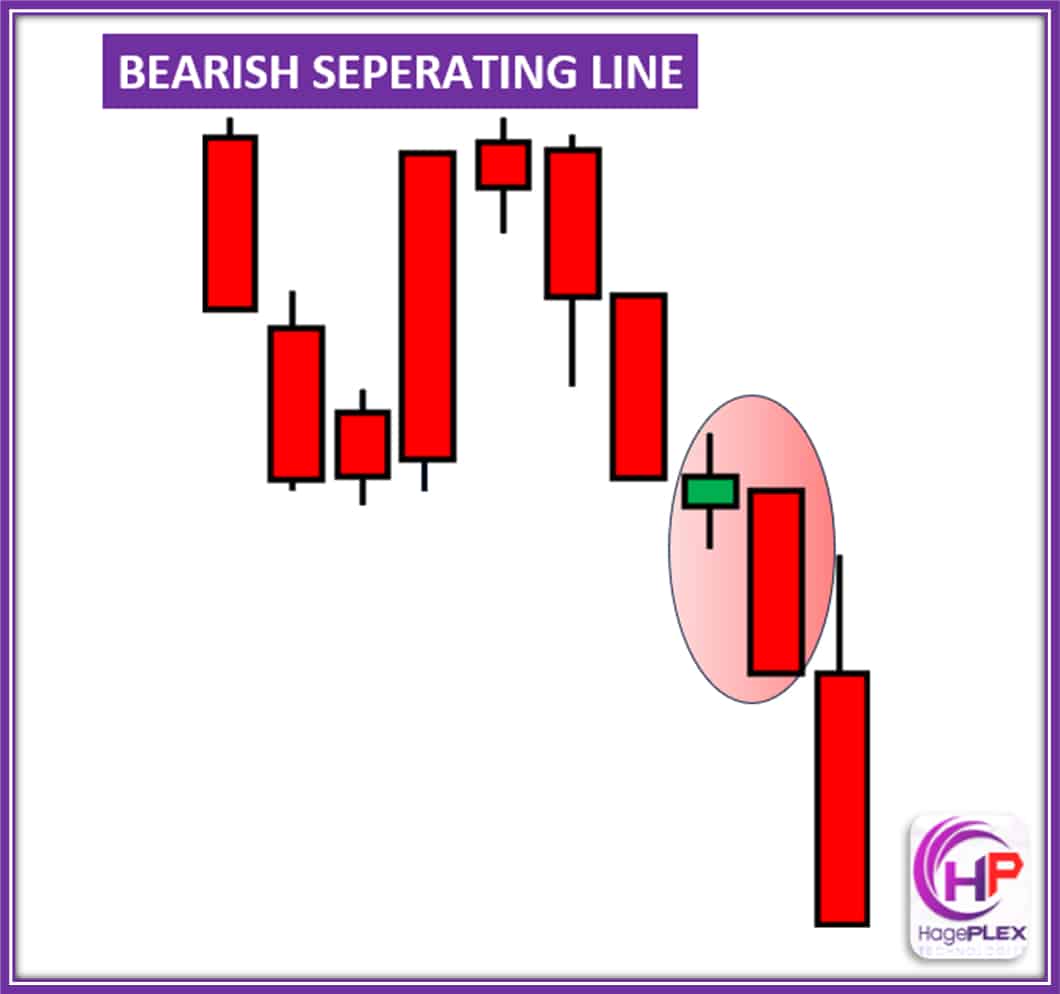
Bearish Separating Line is a two-candle pattern that suggests a shift from buying to selling pressure, indicating a potential bearish reversal.
59. Bearish Mat Hold
The Bearish Mat Hold pattern is a continuation signal that forms during a strong downtrend. It typically appears after a sharp downward movement and often occurs near a previous support-turned-resistance area.
The pattern begins with a strong bearish “impulse candle,” which sets the tone with heavy selling pressure. This is followed by a consolidation phase, where 2 to 3 small bullish or neutral candles form. These candles stay within the range of the initial impulse candle, indicating a temporary pause or slight pullback. Finally, a bearish breakout candle closes below the low of the first candle, confirming the pattern and signaling that the downtrend will continue.
Key features of the Bearish Mat Hold pattern include tight consolidation, where buyers fail to break above resistance. The last bearish candle confirms that sellers remain in control, leading to a resumption of the downtrend. Visually, it often resembles a bearish flag or pennant on the candlestick chart.
This pattern suggests that although buyers attempt to regain control, their efforts are absorbed by sellers, preventing any trend reversal. The breakout candle serves as confirmation of renewed selling momentum. Traders often use a measured move from the height of the initial bearish candle to project potential price targets downward.
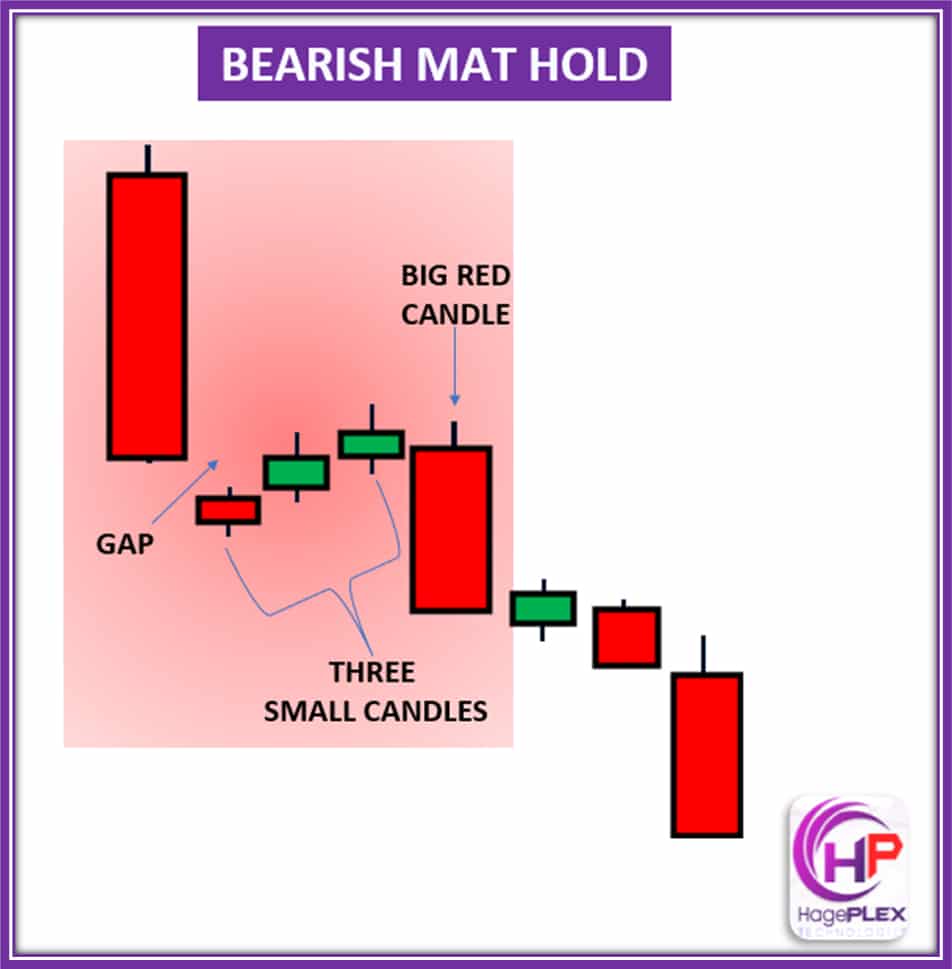
Bearish Mat Hold is a continuation pattern that occurs during a downtrend. It consists of a long bearish candle followed by small bullish candles that fail to reverse the trend, signaling that the bearish momentum will continue.
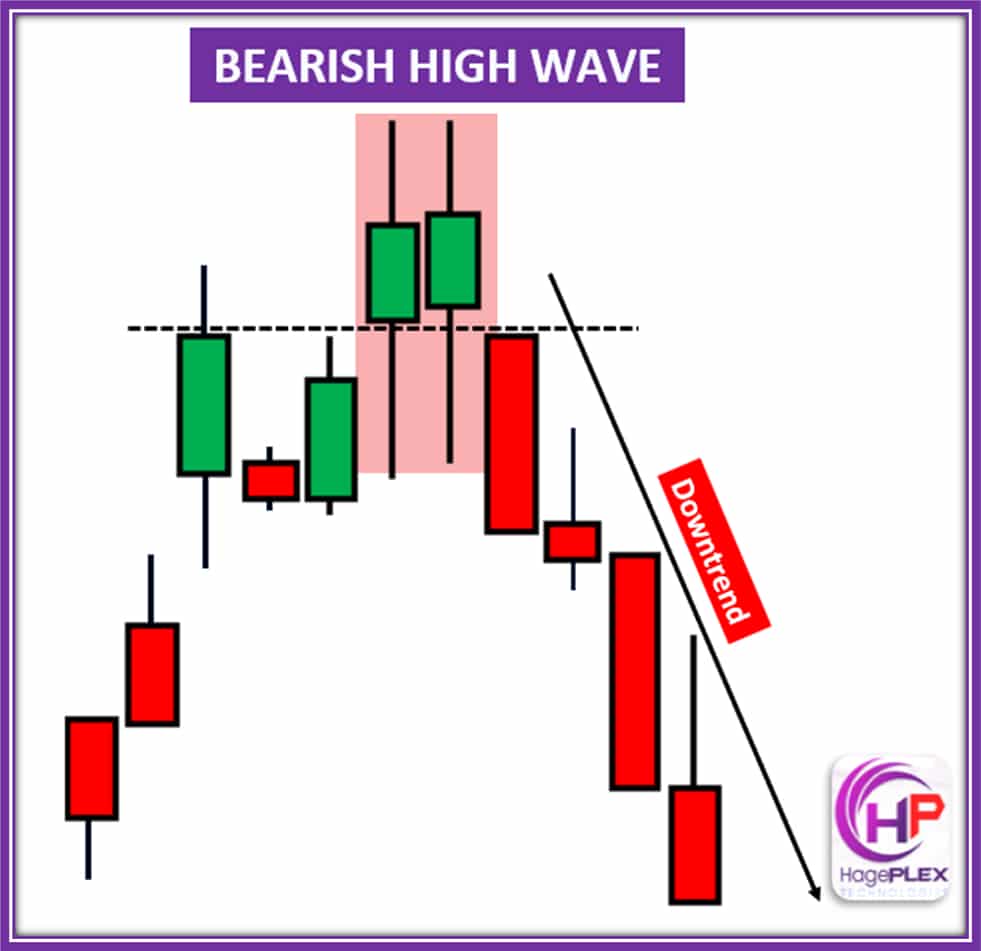
60. Bearish High Wave
The Bearish High Wave pattern signals a potential bearish reversal, typically forming in an uptrend or after a strong bullish move. It can also appear during periods of consolidation, indicating indecision in the market.
The structure of this pattern consists of a small real body, which can be either bullish or bearish, with long upper and lower shadows. Visually, it resembles a long-legged doji or spinning top. This structure shows a tug-of-war between buyers and sellers, where neither side gains clear control.
Key features include extreme market indecision or exhaustion. The upper wick indicates that sellers rejected higher prices, while the lower wick suggests buyers defended lower prices. To confirm the bearish reversal, a bearish follow-up candle is often needed, especially when the pattern forms during an uptrend.
This pattern tells you that while bulls failed to hold higher ground, bears were able to push back, though they lacked full control. The Bearish High Wave often precedes a trend reversal or a period of sideways movement. To confirm the move, traders can enter below the low of the High Wave candle, place a stop loss above the high of the candle, and target the nearest support level, aiming for a 1:2+ risk-reward ratio. Additional confirmation can come from high volume or a bearish follow-through candle.
Bearish Matching High is a reversal pattern where two candles of the same size form at a resistance level, indicating that bulls are losing strength. The pattern suggests a potential reversal to the downside.
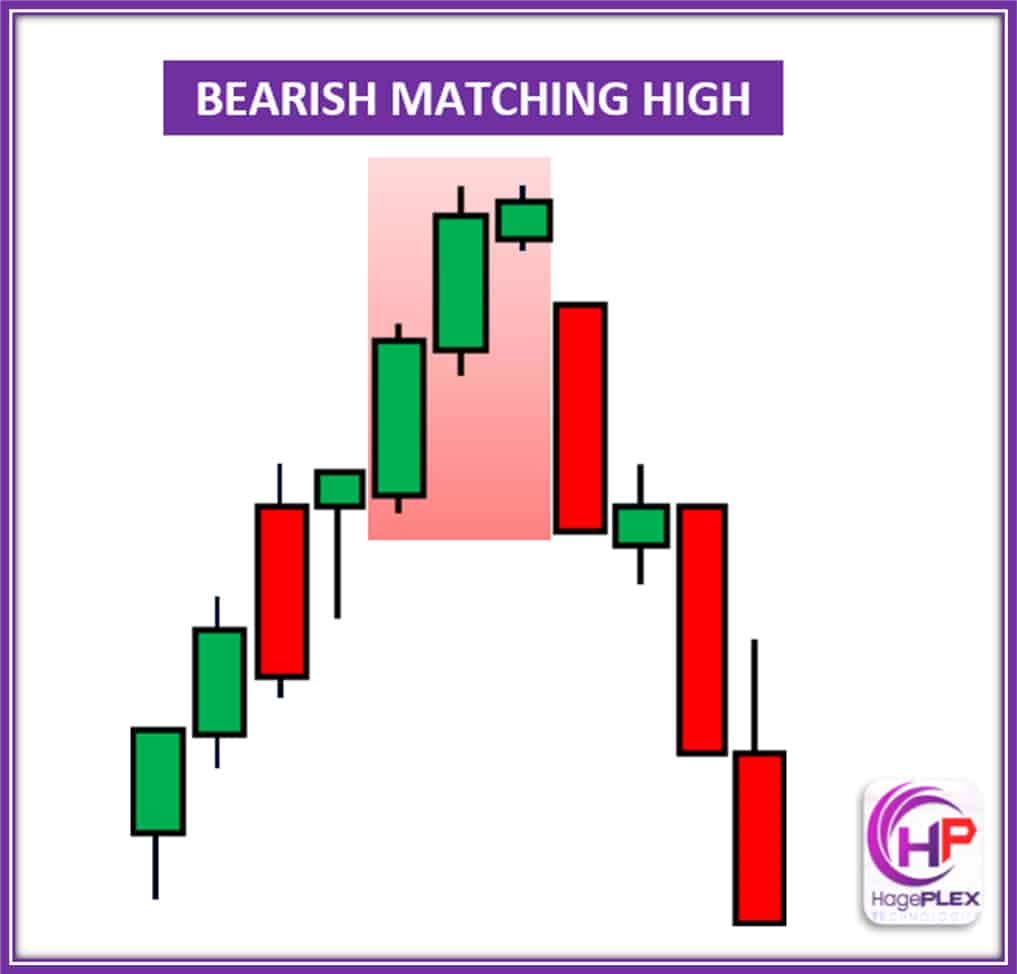
61. Bearish Matching High
The Bearish Matching High pattern indicates a potential bearish reversal and typically forms in an uptrend, especially at resistance levels or overbought conditions.
The structure of the pattern involves two candles. The first candle is a strong bullish candle that closes near its high. The second candle, which can be bullish or neutral, closes at the same price as the first candle. This creates a “matching high” effect, signaling that a ceiling is forming.
Key features of this pattern include the inability of buyers to break above the previous high, indicating that resistance is holding. This failure suggests trend exhaustion, warning that the upward momentum may be fading.
This pattern tells you that bulls may be weakening, as the market rejects higher prices, showing supply pressure. It often precedes a pullback or trend reversal.
The Bearish Matching High
62. Three Black Crows:
The Three Black Crows candlestick pattern signals a potential bearish reversal and marks the beginning of a strong downtrend. It typically forms after an uptrend, overbought conditions, or near resistance levels and premium zones, often following bullish exhaustion.
The structure consists of three consecutive bearish (red) candles. The first candle is a strong bearish candle, followed by a second candle that opens within the first candle’s body and closes lower. The third candle opens within the second candle’s body and also closes lower. All three candles exhibit small or no lower wicks, emphasizing clear seller dominance.
Key features include each candle showing lower highs and lower closes, with the pattern being stronger when each candle closes near its low. This indicates sustained selling pressure.
This pattern suggests that bulls are losing control and bears are taking over, signaling a high probability of a trend reversal or the start of a downtrend. The confirmation of this pattern is stronger when accompanied by a break of structure or key support levels.
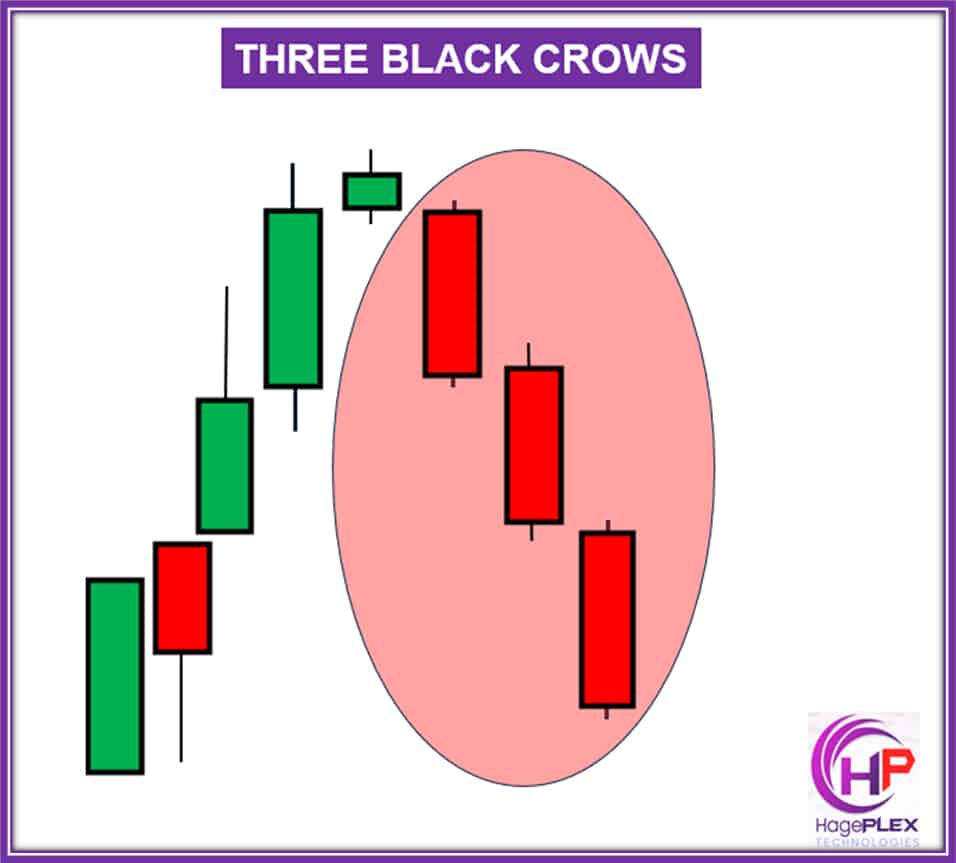
Three Black Crows is a bearish reversal pattern consisting of three consecutive long bearish candles. Each candle opens within the body of the previous one, signaling strong selling pressure and a potential downtrend.
63. Standard Doji
The Standard Doji candlestick pattern signals indecision in the market and can indicate a potential reversal. It typically forms at the top or bottom of a trend, or around key levels such as supply/demand zones or psychological price areas.
This pattern has an open and close that are nearly identical, resulting in a very small or no real body. The upper and lower wicks are often long and balanced, giving the candle a “plus” shape or resembling a cross.
The key feature of the Doji is its representation of indecision between buyers and sellers. It shows that the market is pausing or re-evaluating its direction. On its own, the Doji is neutral, and confirmation from the next candle is necessary to determine the market’s next move.
The Doji suggests that momentum has stalled, and the market is in a tug of war between bulls and bears. Whether it signals a reversal or continuation depends on the context and the confirmation from the following candle.
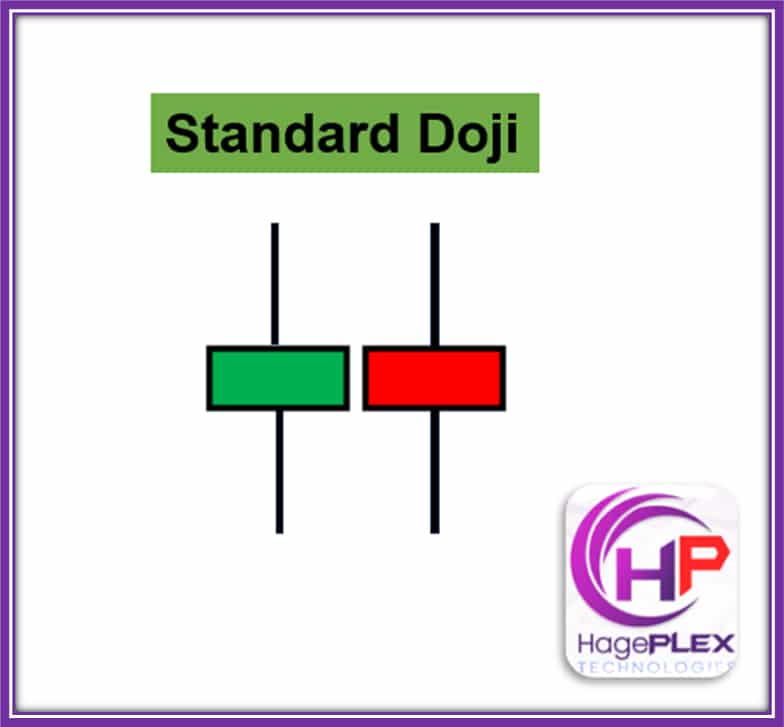
Standard Doji: It represents market indecision, with potential for reversal or trend continuation depending on the surrounding price action.
64. Long-Legged Doji
The Long-Legged Doji candlestick pattern signals indecision and potential reversal in the market. It typically forms at the top or bottom of a trend or near key support/resistance levels, supply/demand zones, or psychological price areas.
This pattern features an open and close that are nearly identical, resulting in a very small real body. It also has long upper and lower wicks, showing high volatility, and it resembles a “plus” sign with extended legs.
The key feature of the Long-Legged Doji is that it reflects a tug of war between buyers and sellers, with price moving strongly in both directions but settling near the open. This signals uncertainty and could indicate a pause or a potential reversal in the market.
The Long-Legged Doji suggests that market participants are undecided, and a turning point may be forming, especially if it is followed by a strong confirming candle. It’s important to look for context clues, such as trend exhaustion or a key level, before reacting to the pattern.
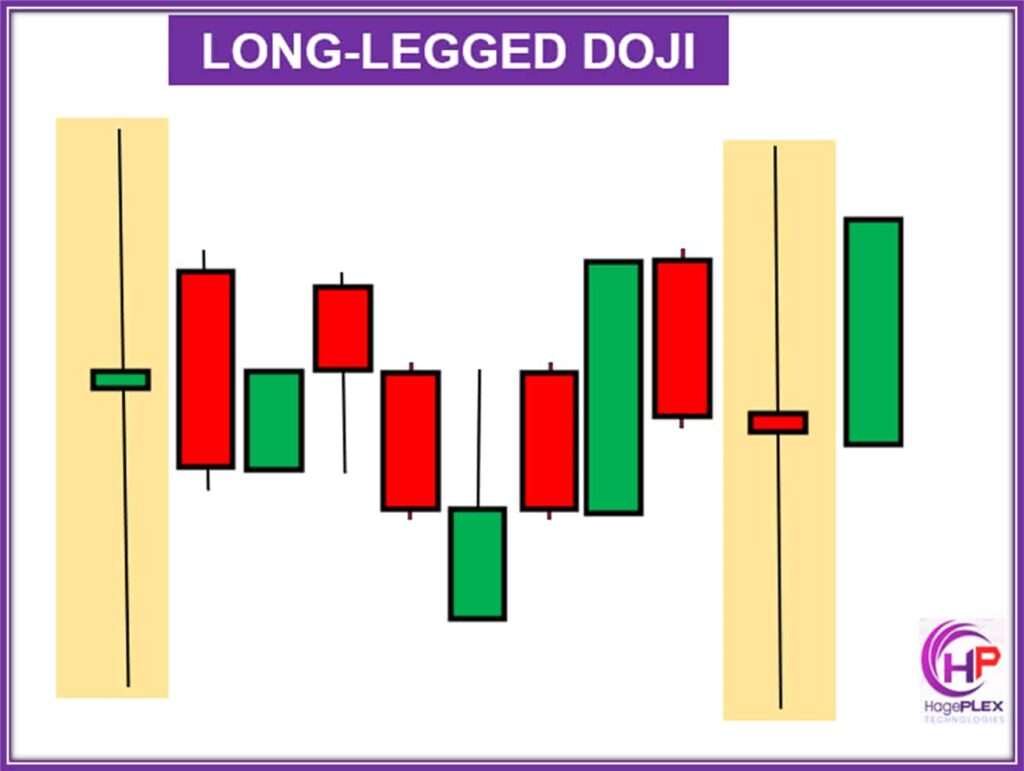
Long-Legged Doji: A candlestick pattern with a small body and long upper and lower shadows, reflecting significant market indecision and volatility, often signaling potential reversal or a period of consolidation.
65. Spinning Top
The Spinning Top candlestick pattern signifies indecision and potential reversal in the market. It typically forms during trends (either uptrend or downtrend) or near key support/resistance levels, often after a strong price move.
The structure of the Spinning Top consists of a small real body, with the open and close being close together. It also features long upper and lower wicks, which are about equal in length, indicating significant price movement in both directions before settling.
The key feature of the Spinning Top is that it represents a struggle between bulls and bears, showing indecision in the market. However, this pattern alone is not strong enough to confirm a reversal and requires additional context or confirmation. It often appears during consolidation or at potential turning points in the market.
A Spinning Top indicates that momentum is slowing down, and the market may be preparing to reverse or consolidate. To confirm a potential reversal, look for a strong candle following the Spinning Top.
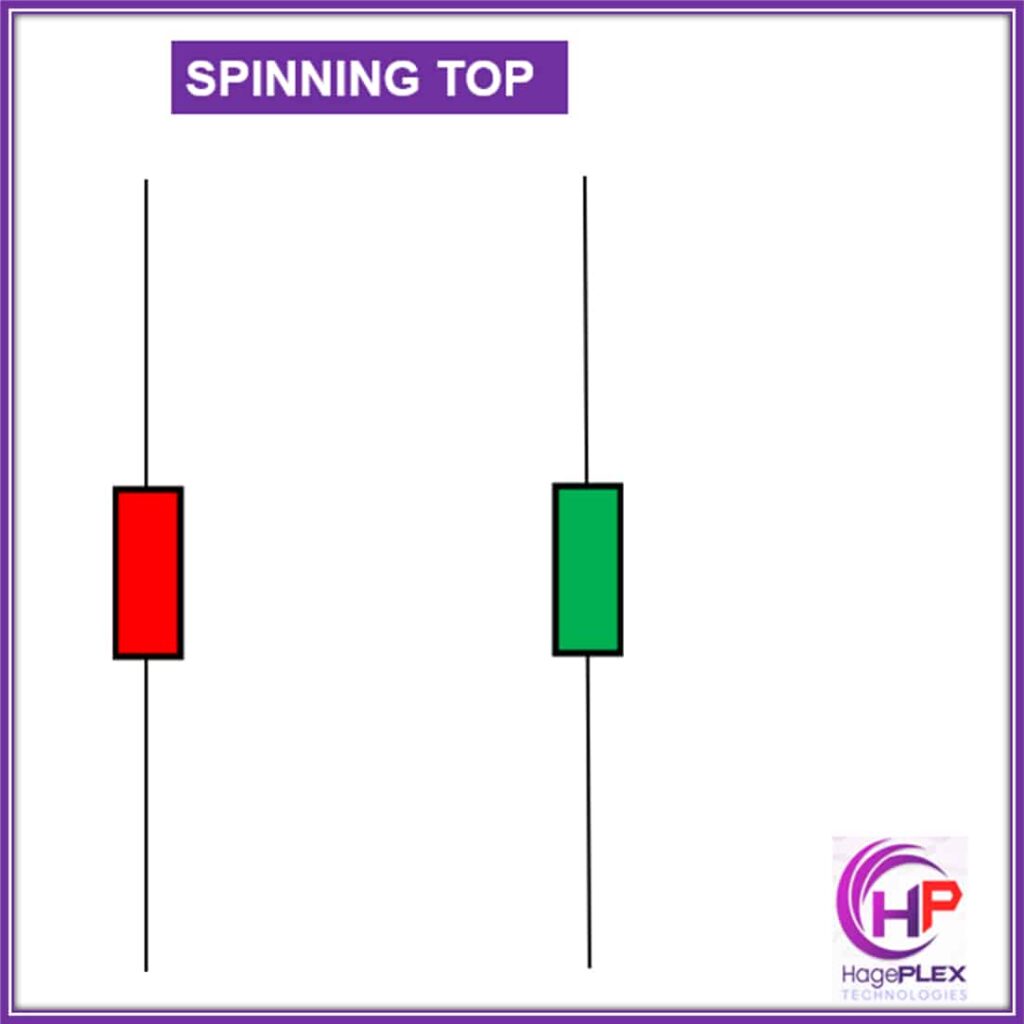
Spinning Top: A candlestick pattern characterized by a small body and long upper and lower shadows, indicating indecision in the market, with a potential shift in direction depending on the following price action.
66. Bearish Harami Cross
The Bearish Harami Cross pattern is a bearish reversal signal, typically forming at the top of an uptrend or after extended bullish movement, often near major resistance zones or after strong rallies.
The structure of this pattern consists of two candles: the first being a strong bullish candle (long green) that shows aggressive buying pressure, followed by a Doji (a very small or no real body) that opens and closes within the body of the first bullish candle. This Doji indicates uncertainty and a potential shift in market sentiment.
A key feature of the Bearish Harami Cross is that the Doji must be completely inside the body of the first bullish candle. This pattern suggests that the buyers are losing momentum, signaling a potential change from bullish to bearish sentiment. The pattern is considered more powerful than a regular Bearish Harami due to the strong indecision indicated by the Doji.
The Bearish Harami Cross tells you that although bulls were in control, indecision has emerged, which may allow sellers to take over. A confirmation candle, such as a strong bearish candle following the Doji, strengthens the bearish reversal signal. Traders often wait for a break below the Doji’s low to confirm entry for short positions.
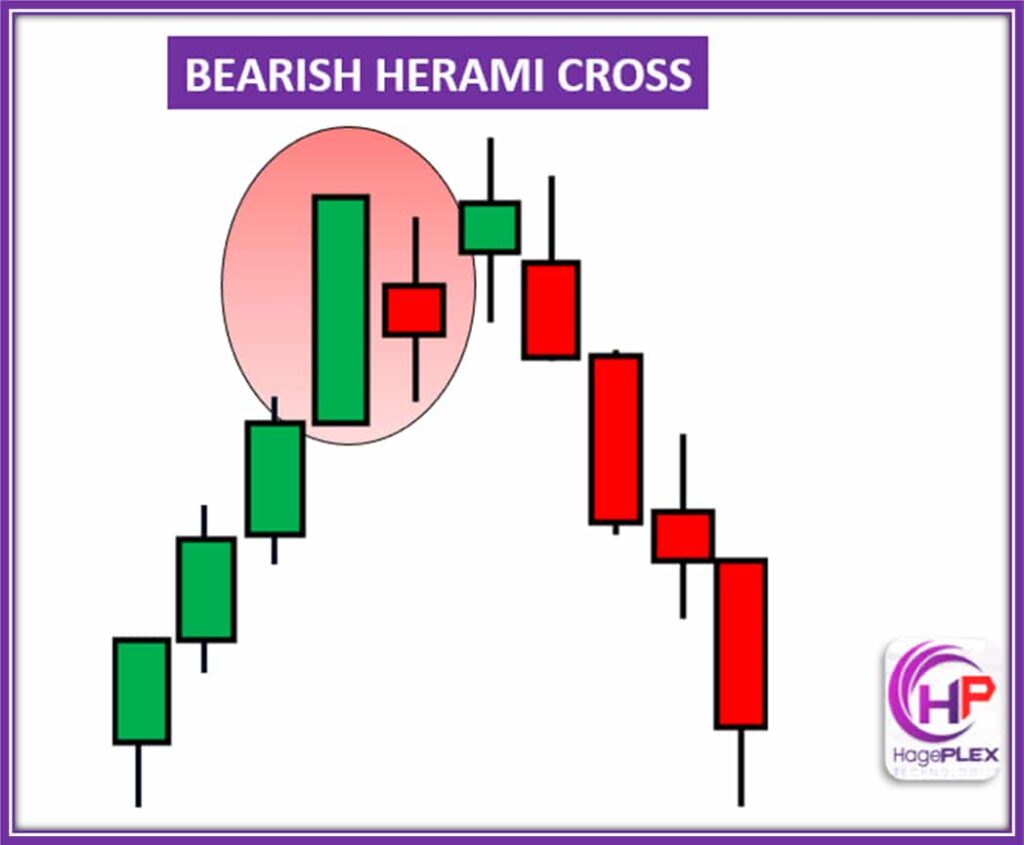
Bearish Harami Cross: A reversal pattern where a small candle (typically a Doji) forms within the range of the previous large bearish candle, signaling potential weakness and a shift towards downward price movement.
67. Bearish Outside Bar Pattern:
The Bearish Outside Bar pattern is a bearish reversal signal, typically forming after a strong uptrend, near key resistance zones, or at exhaustion points. It often marks the end of bullish momentum.
The structure of the pattern consists of two candles: the first being a small bullish or neutral candle, and the second, the Outside Bar, being a large bearish candle that fully engulfs the high and low of the previous candle. This second candle closes below the low of the first candle.
Key features of the Bearish Outside Bar include strong bearish sentiment, with sellers taking full control. The high of the second candle is above, and its low is below the first candle, with the second candle closing near its low, confirming downside momentum. This pattern often aligns with overbought signals or resistance rejection, and can mark a short-term top or reversal.
This pattern tells you that while bulls tried to push higher, they were overwhelmed by aggressive sellers who reversed the move. A breakdown and close below the first candle’s low confirm the shift in control from buyers to sellers. The Bearish Outside Bar often indicates a potential trend reversal or a deep pullback.
For the measured move target, you can project the height of the outside bar downward or use support zones or Fibonacci retracements to identify possible target levels.
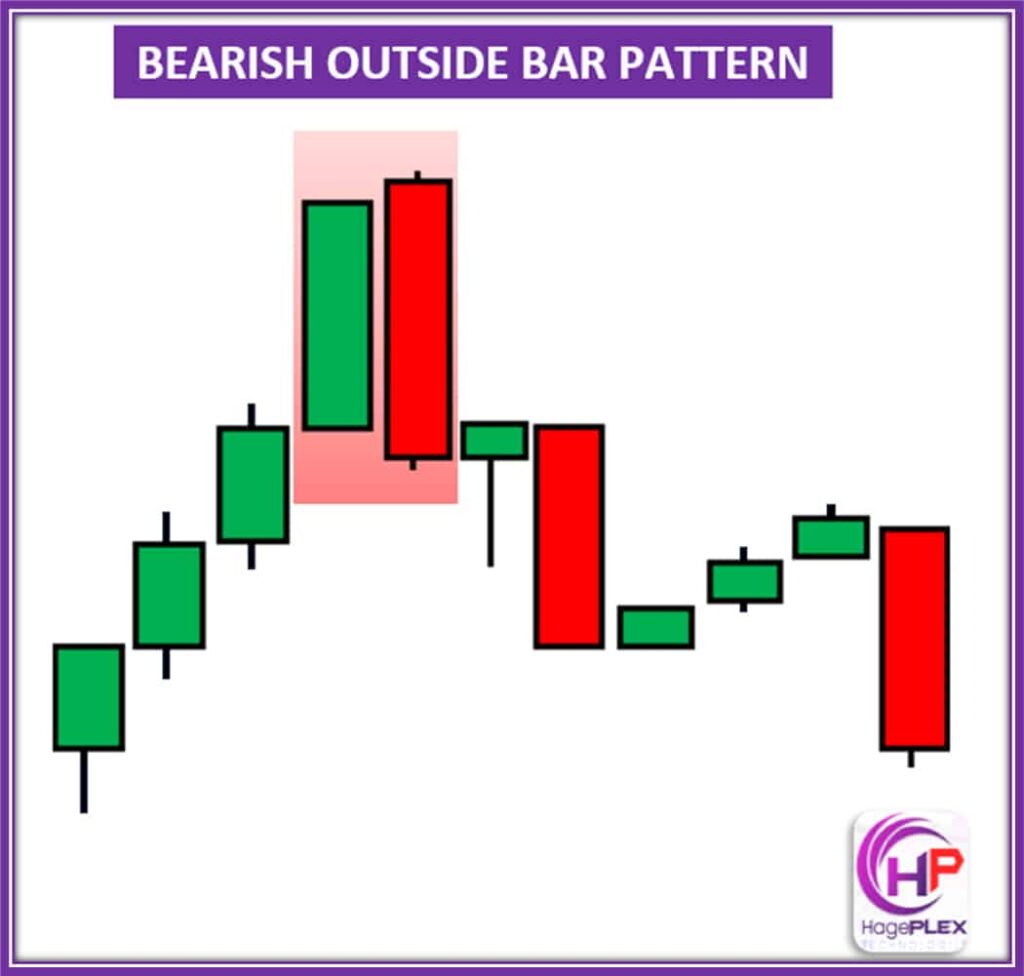
Bearish Outside Bar Pattern: A signal of potential market reversal, where the current bar fully engulfs the previous one, indicating a shift towards downward momentum.
68. Bullish Harami Cross
The Bullish Harami Cross pattern is a bullish reversal signal, typically forming near the bottom of a downtrend or after prolonged bearish movement, often at major support zones or following strong sell-offs.
The structure consists of two candles: the first being a strong bearish candle (a long red candle) indicating aggressive selling pressure, and the second being a Doji, with a very small body, which opens and closes within the body of the first candle. This Doji signals indecision and a potential shift in momentum.
Key features of the Bullish Harami Cross include the Doji staying entirely inside the real body of the first candle, which is a crucial point. The pattern represents a strong slowdown in bearish momentum, suggesting that sellers are losing strength and buyers may be preparing to take control. This pattern is often considered more powerful than a regular Bullish Harami because the Doji signals extreme indecision.
What this pattern tells you is that while bears were in control, hesitation has appeared, indicating that buyers may be ready to step in. A confirmation candle — a strong bullish candle after the Doji — increases the strength of the reversal signal. Traders typically watch for a break above the Doji’s high to confirm the entry for a bullish reversal.
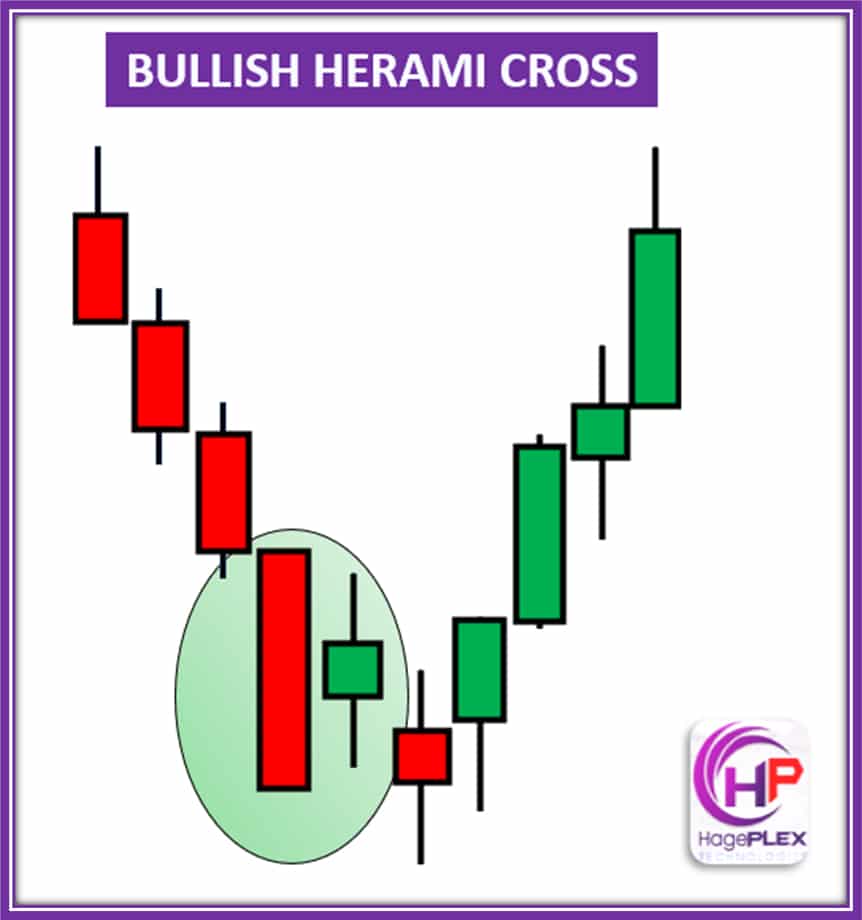
A bullish reversal signal: The Bullish Harami Cross pattern occurs when a strong bearish candle is followed by a Doji that stays within its body, indicating indecision and a potential shift toward buying pressure.
69. Bullish Outside Bar Pattern
The Bullish Outside Bar pattern is a signal of a potential reversal or continuation, depending on the context. It typically forms after a downtrend, suggesting a possible reversal, or during a pullback in an uptrend, signaling that the trend may continue. This pattern often appears near key support levels or trendline bounces.
The structure of the pattern consists of two candles. The first candle is a bearish or small neutral candle, indicating that sellers are still in control or there is uncertainty in the market. The second candle is a strong bullish candle that completely engulfs the high and low of the first candle, covering its entire range with both the body and wick.
What makes this pattern notable is that the second candle, often referred to as an “outside bar,” has a high that is higher and a low that is lower than the previous candle. It also closes near its highs, which shows strong buying pressure. The pattern effectively invalidates the bearish sentiment from the first candle and indicates a shift in momentum towards the buyers. This shift is particularly strong when the pattern is accompanied by higher volume.
The Bullish Outside Bar tells us that while sellers tried to push prices lower, they were overwhelmed by the buying pressure, suggesting a possible bottom or continuation of the uptrend. Traders typically enter by placing a buy order above the high of the second candle, with stops placed below its low. Target levels for this trade are often set at recent resistance zones or derived from a measured move based on the range of the outside bar.
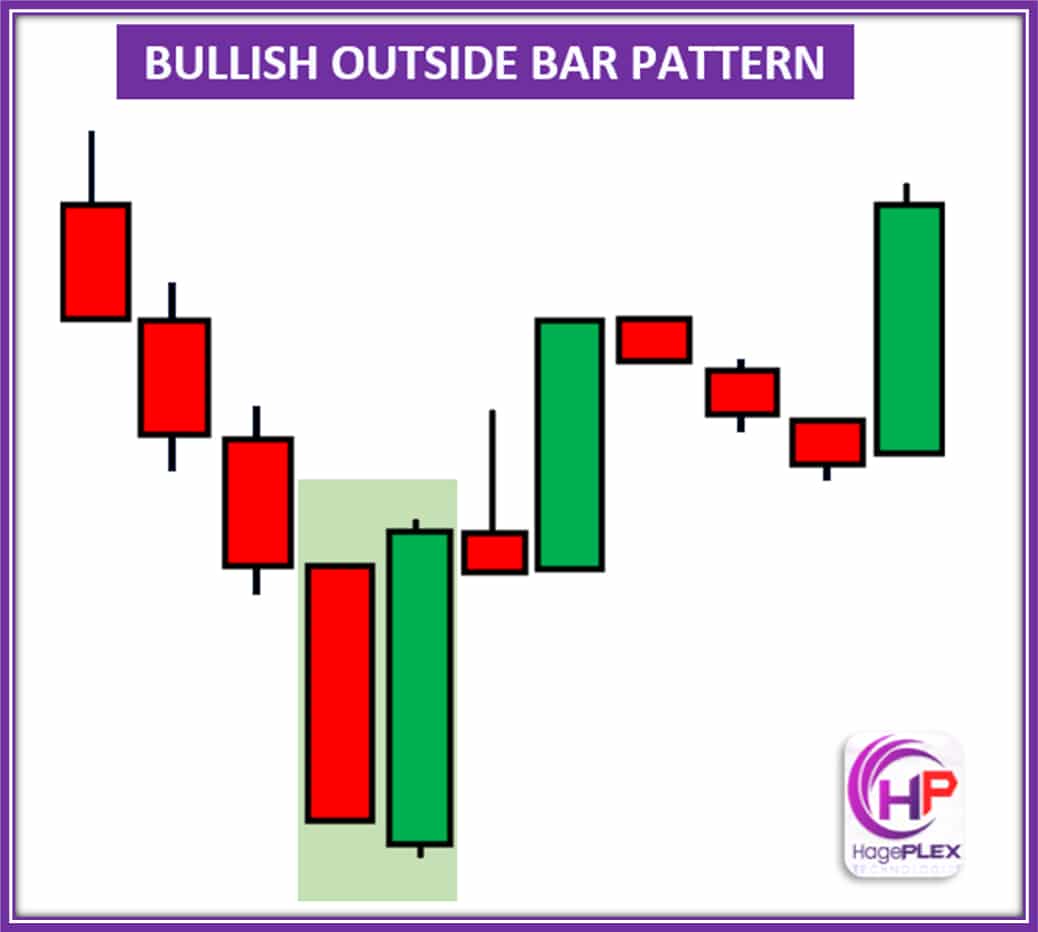
A powerful reversal or continuation signal: The Bullish Outside Bar pattern forms when a large bullish candle completely engulfs a smaller bearish candle, signaling a shift in momentum from sellers to buyers.
70. Bearish Full Marubozu
The Bearish Full Marubozu is a strong candlestick pattern that signals a potential reversal or continuation of a downtrend. It represents total dominance by sellers during a trading session, with no trace of buyer control. This pattern is highly significant in technical analysis because it visually shows intense selling pressure, making it a reliable indicator of bearish sentiment.
This candlestick typically forms at the top of an uptrend as a reversal signal or within a strong downtrend as a continuation pattern. Traders often look for it near resistance zones, after overbought conditions, or at key breakdown levels. The ideal conditions for a Bearish Full Marubozu include a clear uptrend followed by a large red candle that shows a decisive rejection of higher prices.
Structurally, the Bearish Full Marubozu has no upper or lower wicks—its open equals the high, and its close equals the low. This creates a long bearish body, clearly indicating that sellers were in control from the very start to the end of the session. It suggests there was no meaningful buying activity, reinforcing the strength of the bearish momentum.
What this pattern tells traders is simple: the bears have fully taken over, and any attempts by bulls to push the price higher were ineffective. The market sentiment has shifted sharply toward selling, and the probability of continued downside movement is high. This signal becomes even more powerful when supported by volume surges, bearish indicators like RSI below 50, or confluences such as resistance zones.
To trade the Bearish Full Marubozu, a confirmation strategy is recommended. Traders may enter a short position below the candle’s low (close), with a stop loss above the high (open). Targets are usually set at the next strong support or based on a 1:2 or better risk-reward ratio. Confirmation with volume spikes or bearish follow-through candles increases reliability and trading confidence.
Overall, the Bearish Full Marubozu is a clear and forceful pattern that should not be ignored when analyzing charts for potential bearish moves.
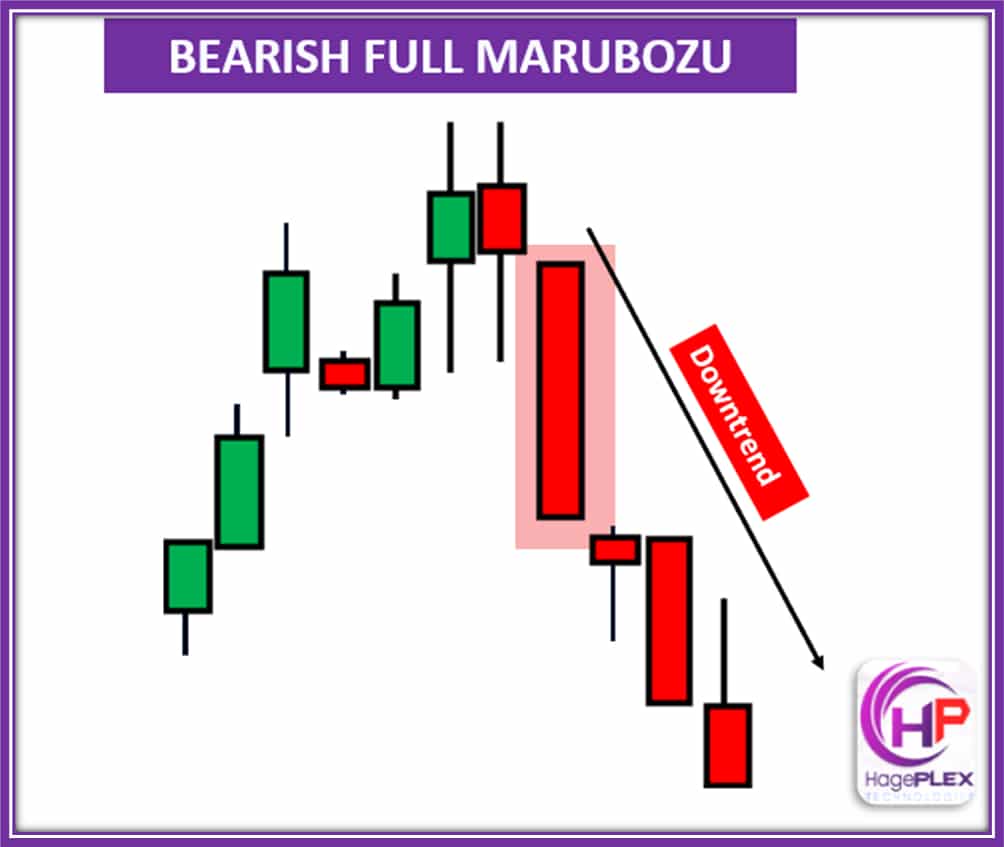
Bullish Full Marubozu – A strong candlestick pattern where the price opens at the low and closes at the high, with no wicks or shadows.
Conclusion:
Understanding candlestick types and patterns is a fundamental skill for any trader aiming to read the markets with precision and confidence. Whether you’re trading forex, stocks, crypto, or commodities, these 70 patterns offer valuable insights into market sentiment, potential reversals, and continuation signals. As with any trading tool, success comes from practice, context, and risk management — not just pattern recognition. Use this guide as a reference in your trading journey, and remember: mastering candlestick analysis is a key step toward becoming a more informed, strategic, and consistent trader.